Dashboard – Visual Item - Grids
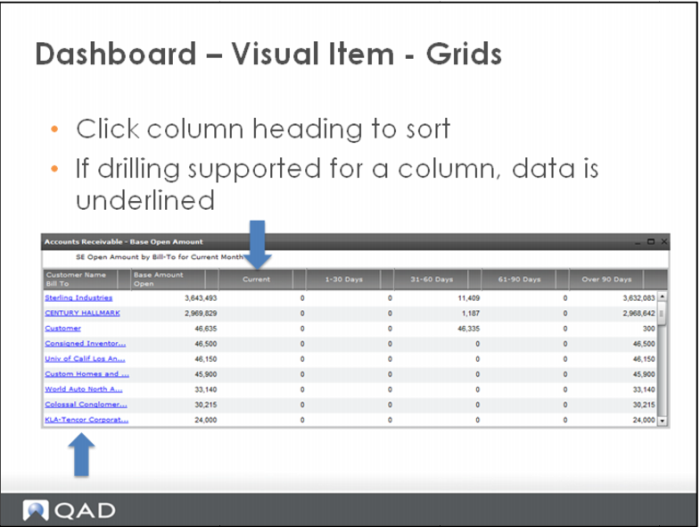
Grids, or tables, allow for a simple, straight-forward arrangement of information in a sorted format. The columns within a grid are sortable, click on the column heading to sort: ascending, descending, and nested sort.
It is also possible to re-arrange columns. Simply click and drag the column heading.
Some grids support drill down. If the item can be drilled into, an underline displays on the data, similar to a link. Click the link to drill into the item to either another visual item or a report. Use the breadcrumbs at the top of the item frame to return to the grid.
Any changes to the grid are not permanent. The grid will return to it’s standard format when the user exits the grid.