Dashboards & Visual Items
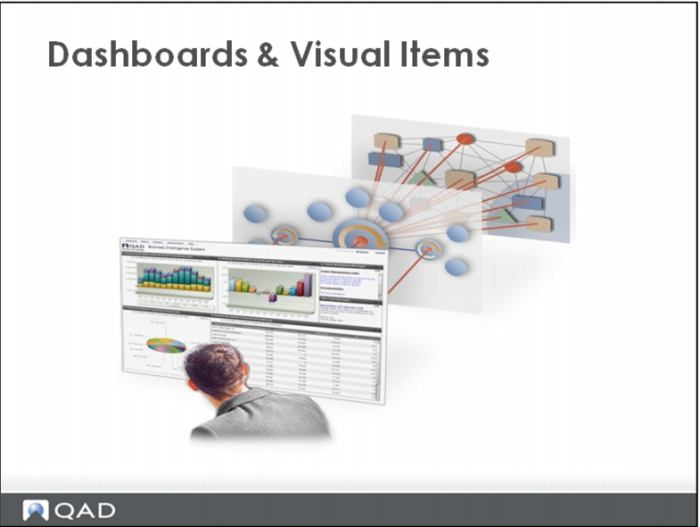
Dashboards provide a way for all participants in the decision loop to view current status of Key metrics, identify exceptions or areas for more investigation, analyze the data and collaborate on that analysis.
Dashboards present data in visual format, and allow users to drill down to increasingly granular information for root-cause analysis.