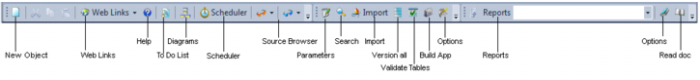
Toolbar
The builder toolbar is shown below:
The diagrammatical view button (diagram view) switches to the diagrammatic window. This window allows the representation and printing of star schema and track back diagrams.
The scheduler button switches to the scheduler control window.
The two source browse buttons (one orange and one blue) allow a quick method of invoking the source browser which populates the 'Browser pane'. Each of the two browse buttons, when chosen, browses to the connection last used for that button. To change the connection being browsed click the down arrow beside the glasses icon.
The Web Links button brings up the on line QAD forum in a new tab. To select or enter other web links, click the down arrow beside the Web Links button.
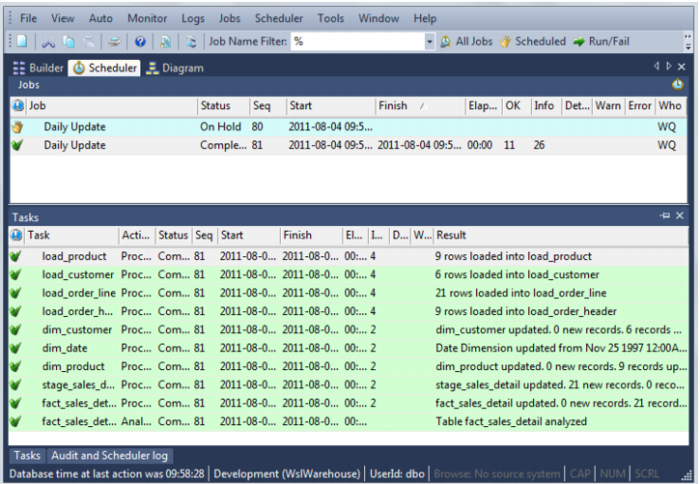
Scheduler window
The Scheduler window is used as the main interface to the scheduler. Jobs can be scheduled, monitored, edited and deleted through this window. The window consists of three panes. The toolbar provides a quick way to display various job selections in the top pane. Other jobs can be displayed through the Jobs menu. Double click on the job in the middle pane to see the tasks of the selected job. Double click on the task to see the audit trail in the bottom pane.
The following is an example of the Scheduler window:
The various options and displays are covered in the Scheduler chapter.