Printable diagram load
If a printable diagram has been saved as a meta file it can be reloaded. To reload a saved meta file switch to diagrammatic view and select the menu option File/Load diagram. A dialog box will allow you to choose a windows meta file (*.wmf). If the meta file had previously been saved from QAD Data Warehouse Designer then the diagram will be loaded.
Star Schema Diagram
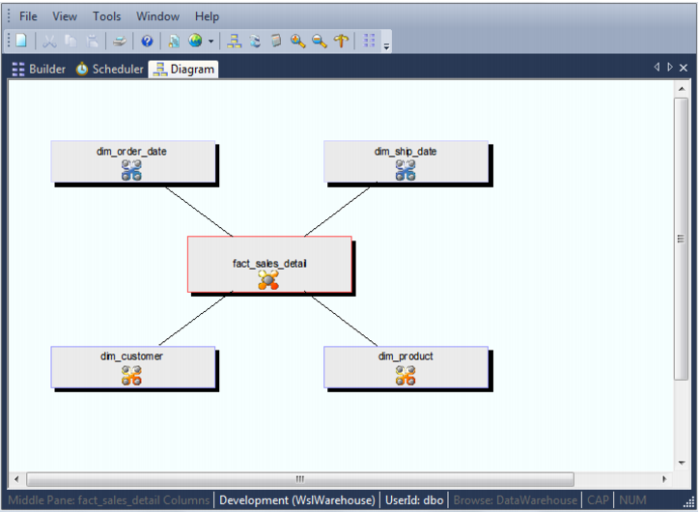
A star schema diagram can be displayed for a fact table or aggregate table. It shows the central table with the outlying dimensions. An example of a star schema diagram both in standard (dialog) format and printable format are as follows:
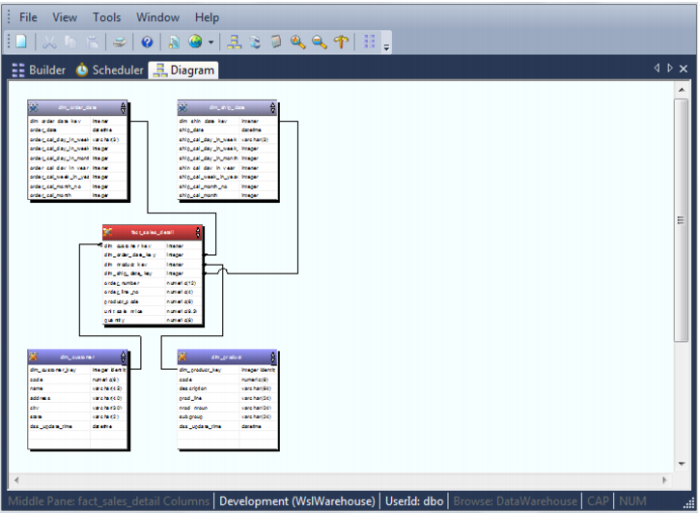
The printable version is displayed below. See the section on printable diagrams for more details.
The printable versions of the star schema diagrams are produced as part of the user and technical documentation when the menu option Doc/Create documentation is chosen from the main builder window.
Source Tracking Diagram
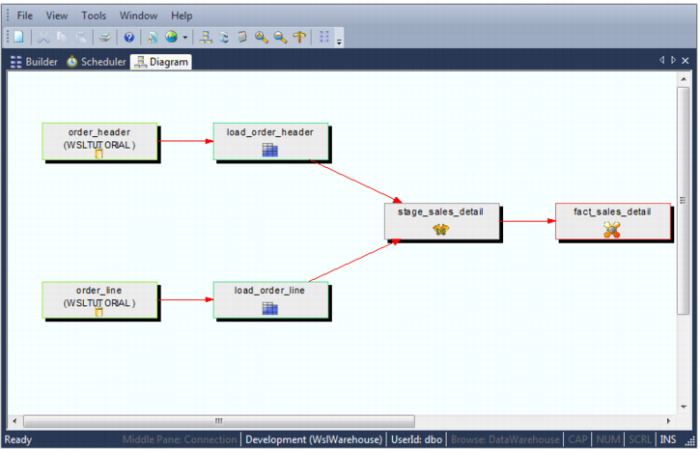
A source tracking diagram can be shown for any table. It shows connections back from the chosen table to the source tables from which information was derived. In the standard (dialog) view the blue lines denote links within the data warehouse database and the green lines show links to data outside of the data warehouse. Hovering the cursor over a line shows additional information. For blue lines the procedure used to move data between the two tables is displayed. For green lines additional information on the source of the data is displayed. If red lines, or boxes appear in a source tracking diagram they indicate a loop situation. If a table is found to be a child of itself then the link or box is colored red and the track back for that branch stops. Sample source tracking diagrams are as follows:
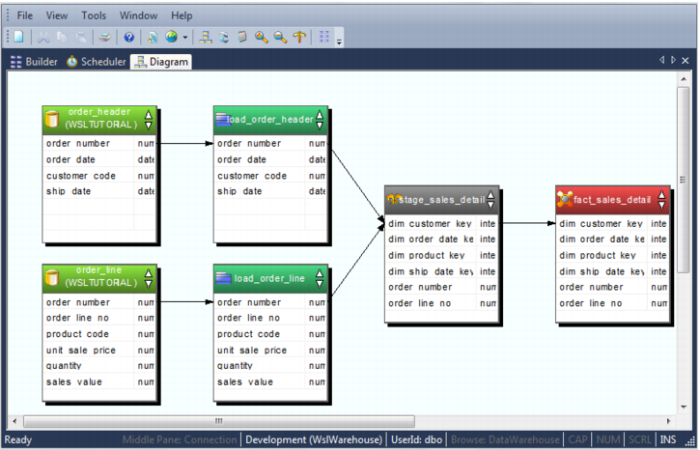
The printable version is shown below.
The printable versions of the source tracking diagrams are produced as part of the technical documentation when the menu option Doc/Create documentation is chosen from the main builder window.