Creating a Job from a Source Tracking Diagram
Once a source tracking diagram has been created for a table, a scheduler job can be generated from the diagram. This job will be called Process_to_table_name, where table_name is the name of the table the track back diagram was run for.
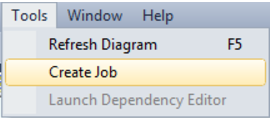
To create a Job, choose Create Job from the Tools menu after the diagram is displayed:
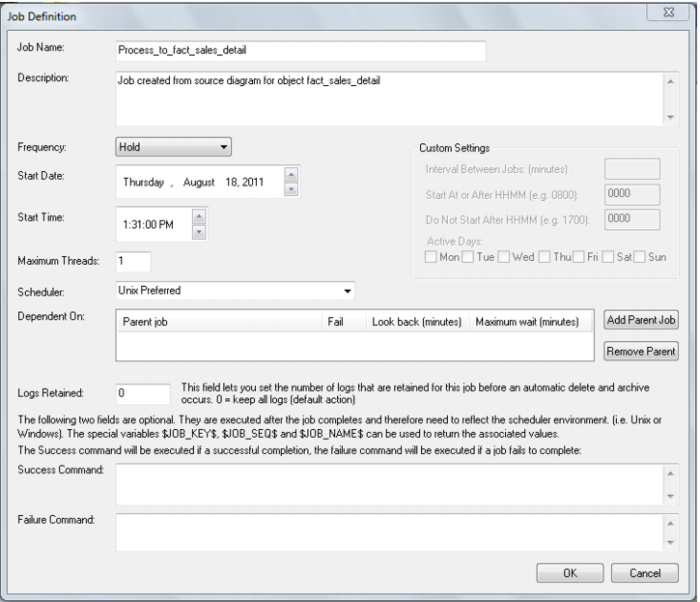
The job properties are then displayed:
Make any changes here that are required and click OK.
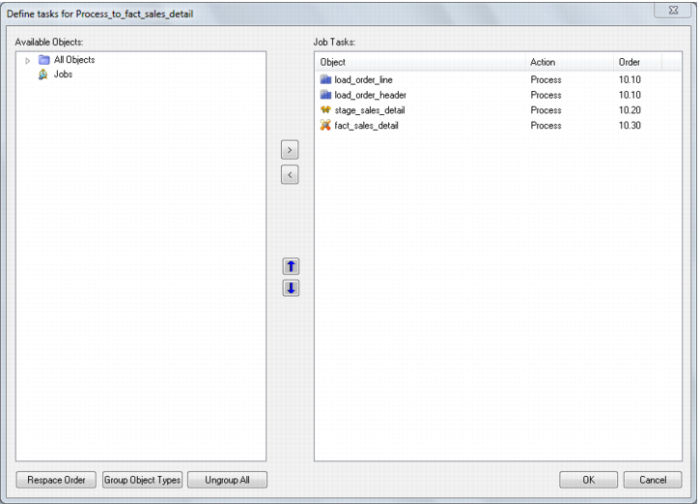
For the diagram above, a job is created with the following tasks:
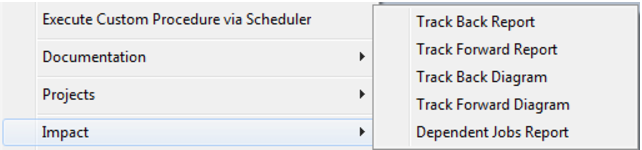
Note: It is also possible to display the source tracking diagram by right clicking on a table and choosing Impact/Track Back Diagram:
Data Join Track Back Diagram
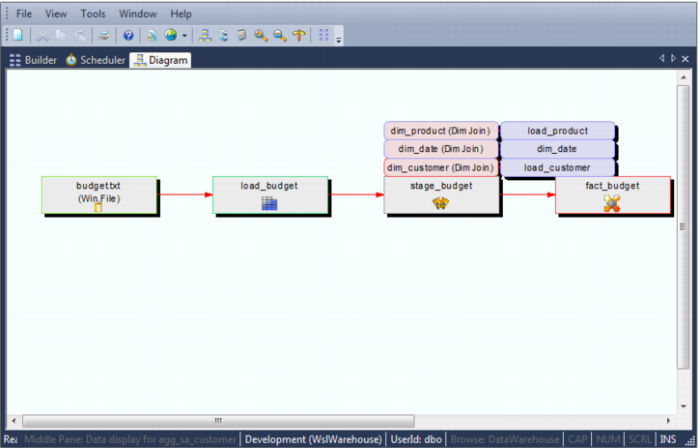
A data join track back diagram can be shown for any table. It shows connections back from the chosen table to the source tables from which information was derived and includes dimension table join. In the standard (dialog) view the blue lines denote links within the data warehouse database and the green lines show links to data outside of the data warehouse. Hovering the cursor over a line shows additional information. For blue lines the procedure used to move data between the two tables is displayed. For green lines additional information on the source of the data is displayed. If red lines, or boxes appear in a track back diagram they indicate a loop situation. If a table is found to be a child of itself then the link or box is colored red and the track back for that branch stops. Below is a sample data join track back diagram:
In the printable version the data sources outside of the data warehouse are colored green and those tables inside the data warehouse are colored blue.
Track Forward Diagram
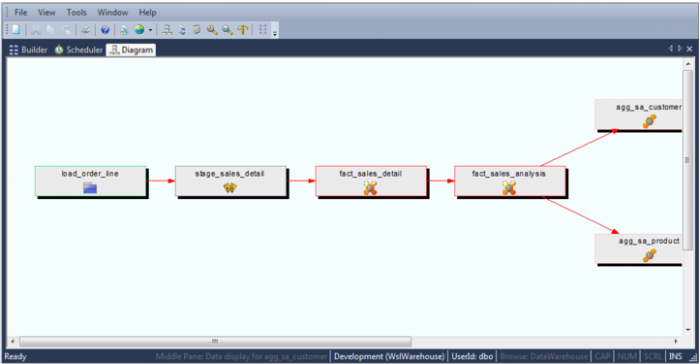
A track forward diagram can be shown for any table. It shows connections forward from the chosen table to the subsequent tables built with columns from this table. This diagram relies on the source table and source column fields in each table type. If these fields do not reflect all of the base tables then the track back and track forward diagrams will not return the correct results. A sample track forward diagrams is as follows:
Note: It is also possible to display the track forward diagram by right clicking on a table and choosing Impact/Track Forward Diagram:
Linked Tables Diagram
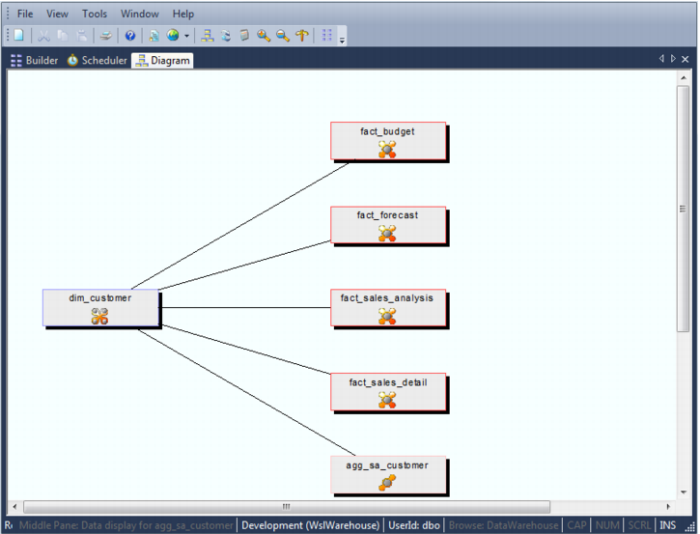
A linked tables diagram can be shown for any table. It shows relationships between tables, looking out from the chosen table a selected number of hops. The number of hops is determined by table relationships and source and target relationships. A sample linked tables diagrams is as follows:
Job Dependencies Diagram
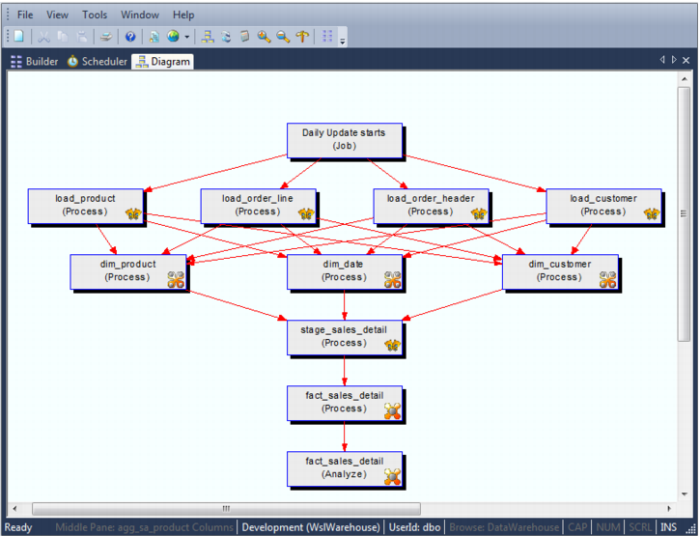
A job dependencies diagram can be shown for any job defined in the QAD Data Warehouse Designer scheduler. It shows the parent and child relationships between tasks within a job.table. A sample job dependencies diagram is as follows: