Using the Dashboard
Click Dashboard from the main menu to open the Dashboard screen. The default dashboard displays. The Dashboard screen can have a maximum of four separate views or components:
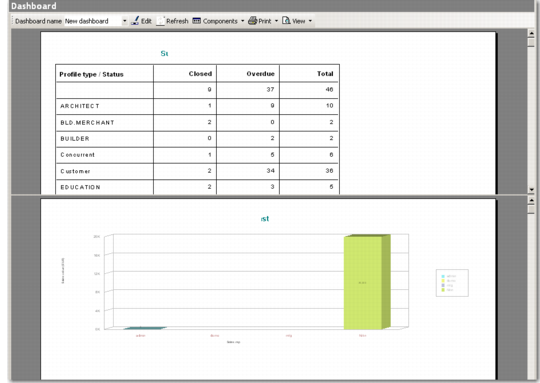
• Activity Summary: Displays closed and overdue activities in table format, according to the sort criteria specified.
• Forecast Sales: Provides a view of the sales forecast for a specified time span in graph or table format.
• Sales: Displays the figures reflecting actual sales within a specified period.
• Top/Neglected Object: Works with a combination of profiles and opportunities, displaying either the highest revenue earners, or those that have not had any activity for a specified time span. It includes three components—Top Profiles, Top Opportunities, and Neglected Profiles and Opportunities.
Dashboard
The dashboard toolbar includes the following:
• Dashboard Name: Use the drop-down to select the dashboard you want to display.
• Edit: Click this button to change the display and data properties of the current dashboard. You can also add or delete existing dashboards through this option.
• Refresh: Click this button to reload the dashboard views.
• Components: Use the drop-down to select which component to edit.
• Print: Use the drop-down to select which component view to print. You can only print one view at a time. All the displayed views cannot be printed together.
• View: Use the drop-down to select which view to display. Selecting All divides the screen to display all the selected component views together.