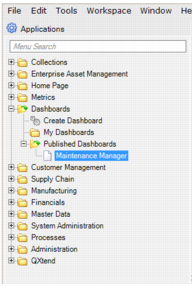
Accessing the Dashboard
The Maintenance Manager dashboard is part of the Dashboards module in the QAD .NET UI. It is not accessible from within the Enterprise Asset Management module in the QAD Enterprise Application. To work with the EAM dashboard, open the Published Dashboards folder within Dashboards and select Maintenance Manager, or type Maintenance Manager into the Applications search.
Maintenance Manager in Dashboard Folder
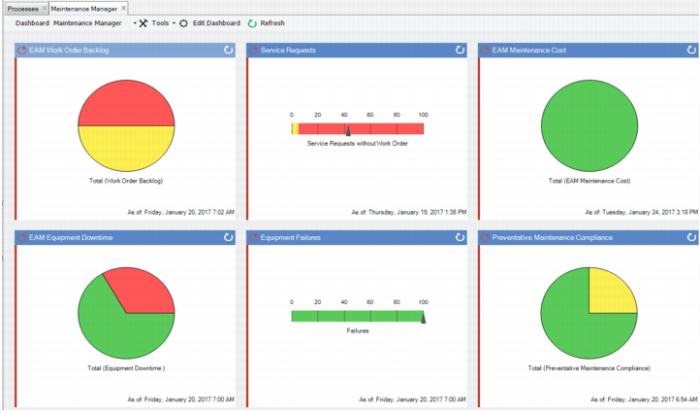
Double-click Maintenance Manager to open the EAM dashboard.
Maintenance Manager Dashboard
The Maintenance Manager dashboard displays six metrics.
• EAM Work Order Backlog
• Service Requests
• EAM Maintenance Cost
• EAM Equipment Downtime
• Equipment Failures
• Preventive Maintenance Compliance
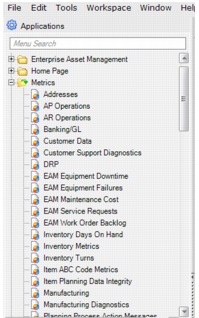
In addition to viewing the metrics on the dashboard, you can access the six metrics directly from the Metrics module, which is also part of the main QAD .NET UI.
EE Metrics Menu