Navigation
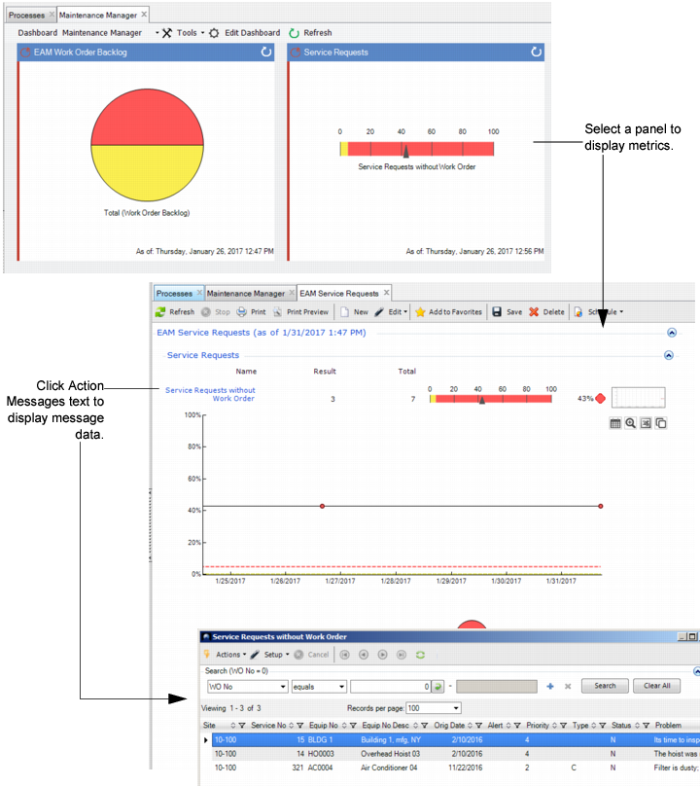
When you click on a panel, you go to the operational metric itself, and from there you can drill into the data used to create the graphics.
Metrics Panel and Resulting Metrics Display
Role-Based Dashboards
The role-based dashboards in the system attempt to achieve the following basic goals:
1 Provide focus to daily work. What are the key activities that a worker in a particular role must do each and every day? What kinds of data or information would help that worker prioritize the daily work? Is it possible to provide an effective index to the current backlog of work, isolating the vital few problems that need to be addressed from the trivial many that can be safely deferred? Where can workers best spend their limited time?
2 Wherever possible, extend the existing capabilities of EAM. In some cases, this takes the form of additional functionality; in other cases, it reorganizes the way existing data displays for you, which, in effect, improves the user interface to key system functions.
3 Show current performance against key metrics and key performance indicators as well as how performance has changed over time.
4 Provide more real-time metrics as alerts to issues while there is still time to take action. While there are still many displays of historical performance and trends, the key to improving performance is to shorten the response time between when a problem occurs and when workers know about it.