Report Analysis Code
Reporting cube data is stored in detail for each combination of COA elements. In this raw form, there are thousands of possible combinations. When building a report, it is time-consuming to specify these combinations individually.
Therefore, to facilitate report creation, you can create a new object called a report analysis code. Each analysis code contains a set of filters on COA dimensions. This filter set enables you to retrieve data selectively from the cube. The analysis codes are dependent on the report COA. You can reuse them for many different cubes that share the same report COA.
Report Building Blocks
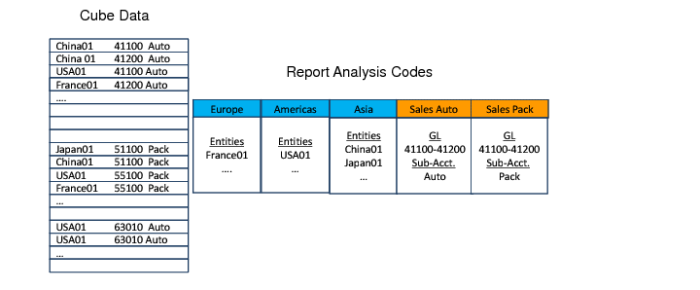
Report Analysis Code Example
In this example, the report analysis code Europe lets you retrieve data from the report cube for the entity France01. Similarly, the report analysis code Sales Auto lets you retrieve data from the report cube for sub-account Auto, combined with GL accounts in the range 41100-41200.
The report analysis code behaves like a dynamic filter. When new GL accounts are added to the range 41100-41200, these accounts are automatically included in the report analysis code filter result. When you define the report tree (hierarchy), report analysis codes are linked as nodes of the tree.
The lowest level nodes are called leaf nodes, which also correspond to the detailed rows on the report. When you define the final report columns layout, you can specify the columns on the report. You can also apply a report analysis code to a column.
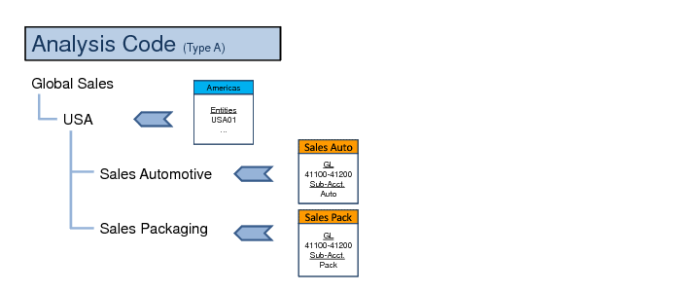
In the report analysis code example above, Sales Auto and Sales Pack are analysis codes applied to the detailed rows of the report. Europe, USA, and Asia are analysis codes applied to nodes higher in the tree. In the final result, one branch of the report shows the sales for Europe. A second branch shows the sales for the USA and a third branch the sales for Asia.
You can also apply analysis codes to columns in the report. This enables you to display Europe Sales, USA Sales, and Asia Sales as columns next to each other. Use Report Analysis Code Maintenance to maintain the report analysis code.
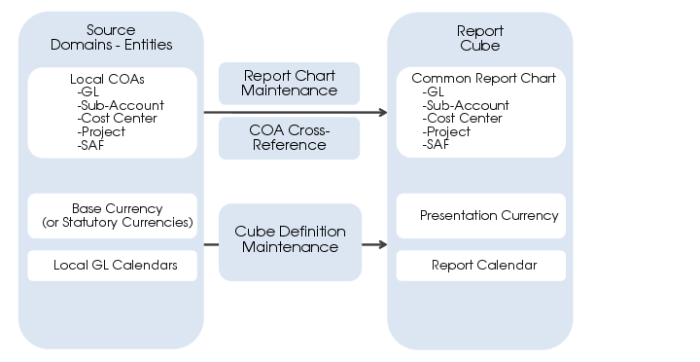
Report Chart
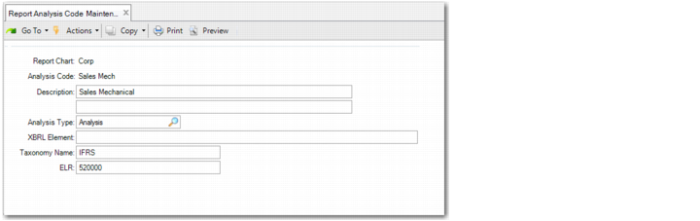
Specify the report chart code. This field is mandatory, and must contain an existing report chart code. Financial Report Writer retrieves financial data from several source domains to form a common reporting COA. The report chart is composed of a GL account shared set, a sub-account shared set, a cost center shared set, a project shared set, and SAF concepts. It also includes the COA cross-references that translate the COA of the source domains to the report COA. The detailed elements of the report analysis code are based on the selected report COA.
Analysis Code
Enter an alphanumeric analysis code. This field is mandatory.
Description
Enter an analysis code description. This field is mandatory.
XBRL Element
Specify the XML element name tag used in the XBRL taxonomy. For example, each balance row in the IFRS-XBRL taxonomy has a unique XBRL element name as an identifier, such as AssetsAbstract.
Analysis Type
Specify the type of analysis code. This field is mandatory. There are four types:
• Analysis type analysis codes retrieve data from the cube according to specific selection criteria you enter on subsequent screens.
• Calculate type analysis codes contain calculations with other analysis codes.
• Sub-Total type analysis codes are used at a high level in the report hierarchy tree and summarize low-level nodes.
• Text type analysis codes contain labels that are printed on the report.
Taxonomy Name
Specify the name of the taxonomy that applies, and to which the report analysis code belongs. There are multiple XBRL taxonomies, such as IFRS XBRL and US GAAP XBRL. Each taxonomy has specific structures and element naming conventions.
ELR
Specify the ELR code that identifies the report structure in the taxonomy. In each taxonomy, subdivisions are used to target reporting sub-areas with their own relational structure and label structure. These subdivisions are referred to as Extensible Linkbase References (ELRs). An ELR can relate to a single report.
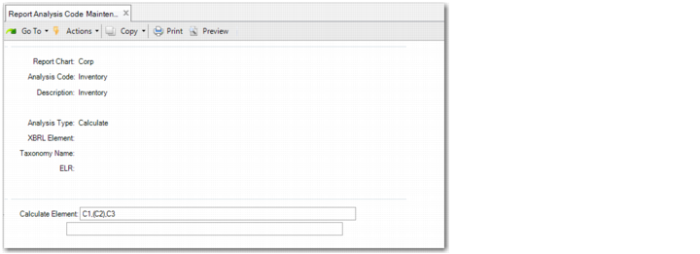
If the Analysis Type is set to Calculate and you click Next on Screen 1, the following screen is displayed:
Calculate Element
This field is only displayed when the analysis code type is Calculate. You can enter two types of calculations:
Summations: If you enter a list of report analysis codes, each separated by a comma, you can calculate the sum of balances. For example, C01, C02, C05 results in the sum of report analysis codes C01 + C02 + C05. In this type of calculation, you can also subtract. To do this, place the report analysis code in brackets. For example, C01, (C02), C05 results in the sum of report analysis codes C01 – C02 + C05.
Multiplications or divisions: You can enter a maximum of three factors separated by * or /. For example, to calculate C01/C02*C05, the system first divides C01 by C02 and then multiplies the result by C05. You can also use constants. For example, to calculate C01/C02*100, the system first divides C01 by C02 and then multiplies the result by 100. This method is useful for percentage calculations.
Cascaded Calculations
You cannot combine summations and multiplications or divisions in a single calculation report analysis code. However, you can use the result of a calculation as a component of a calculation in another report analysis code.
Example: Report analysis code C04 of type Calculate has the formula C01, (C02), C03 and report analysis code C06 of type Calculate has the formula C04/C05*100. The result in C06 = ((C01 – C02 + C03)/C05)*100).
You cannot use brackets in multiplication or division calculations. However, you can circumvent this restriction using cascaded calculations.
Example: If you want to calculate C05 = C01/(C02*C03), brackets are not allowed in the formula. C05 = C01/C02*C03 does not give the correct result because this calculation first divides C01 by C02 and then multiplies the result by C03. Therefore, you must create C04 = C02*C03 and then C05 = C01/C04.
Be careful not to create circular references when using cascaded calculations.
Example: C04=C01*C02, C05=C03/C04, and C02=C05/C06 are not allowed in the same report tree. The value of C02 depends on the value of C05 (last calculation) and, similarly, the value of C05 depends indirectly on the value of C02 (the first two calculations). This causes the report run program to abort with an error message.
If the Analysis Type is set to Analysis on Screen 1 and you click Next, the following screen is displayed.
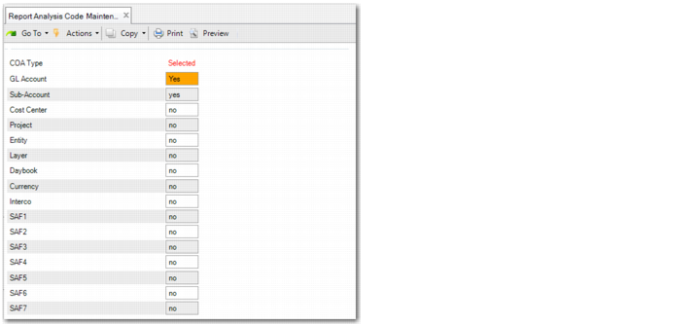
Screen 2 lists the element types that you can filter on. Using the space bar or mouse, you can toggle between the yes and no values in the Selected column. When you have set the filter, click Next.
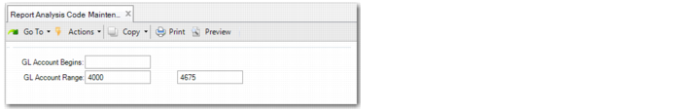
Screen 3 allows you to select codes beginning with a value or codes in a range of values. After you enter the initial criteria (optional), click Next.
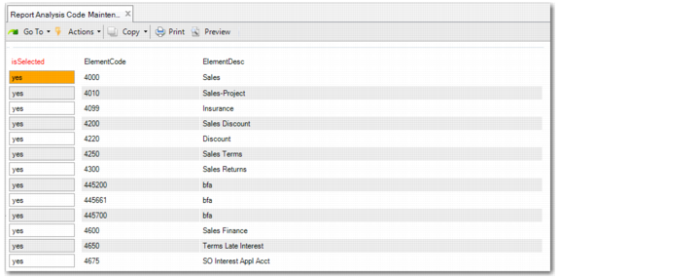
Screen 4 lists the chart records that match the initial selection. Using the space bar, you can toggle between the yes and no value in the isSelected column. Use the Page Up and Page Down keys to scroll through the list.
Note: For COA dimension sub-account, cost center, project, intercompany and SAFs1-10, the Code <blank> is also available on Screen 4. When <blank> is selected, it means that this report analysis code retrieves data that has no Sub-account, Cost Center, and so on.
On this screen, you can change the values you entered on Screen 3 in the GL Account Begins and GL Account Range fields. If you change these values, the fields on Screen 3 are blanked out, indicating that you have manually changed the selection. However, if you do not change the selection on Screen 4 and save the analysis code, the criteria from Screen 3 are also saved. In this case, if new accounts are created in the chart, they are automatically added to the analysis code if they match with the values in the GL Account Begins and GL Account Range fields.
After completing or reviewing the selection on Screen 4, click Next. If you chose only one dimension on Screen 2, then the program returns to the first screen and the data is saved. If you chose more than one dimension on Screen 2, Screen 3 and Screen 4 are repeated for each additional dimension.
If you already made a selection for a dimension and you go back to Screen 3 to modify the initial filter, the system prompts you to keep the values of the previous selection. If you choose Yes, the selected list on Screen 4 contains the list of the old element codes plus the element codes in the current filter. If you choose No, a new list of selected elements replaces the old selection.