A Picture is Worth a Thousand Words
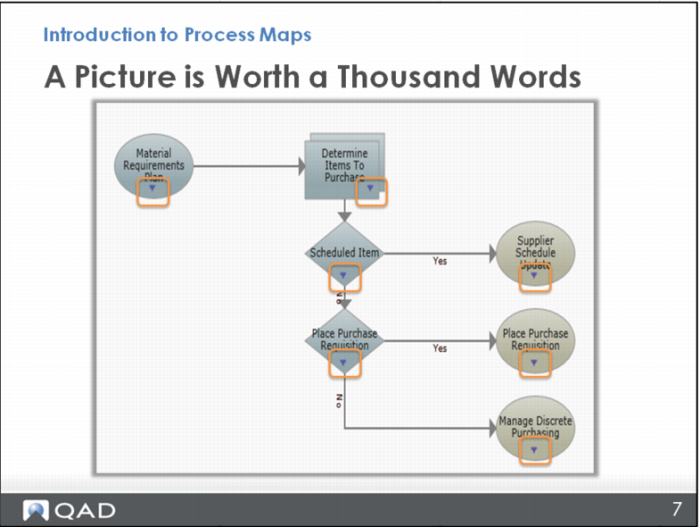
So, rather than a simple flow chart about scheduling production, you can have a process map with links to the screens to use for that step and the supporting training documentation.
This is an example of the QAD Planning and Scheduling process map.
An icon within the node represents multiple links associated with the node.