Using Enhanced Reports
This topic includes a brief overview of the basic steps used to generate a report. For more information on filters, output options, and so on, see User Guide: QAD Reporting Framework.
Running a Report
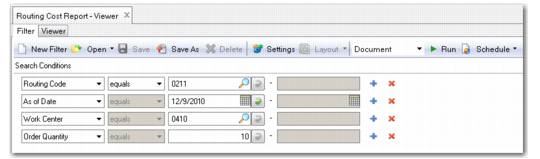
1 Access the report. The Report Filter screen is displayed in the application area.
Report Filter
2 By default, a report displays all the records available in the source data. However, you may want to retrieve just a certain range of records in the report; for example, routing costs for an item at one specific work center. You do this by setting search conditions to filter data in the report for one or more of the available criteria.
a Configurable filter capabilities let you create both simple and complex queries. Choose a search operator from the drop-down list: equals, not equals, and so on.
b If you choose the Range operator, enter a beginning value of the range in the first search box. Optionally, enter an ending value of the range in the second search box.
c To refine your search further, click the plus (+) icon to add another search row. You can add as many rows as needed, each with different search values and operators. When you specify several criteria, note that multiple criteria for the same field are treated as a logical AND condition.
d To remove a search criteria row, click on the delete (X) icon.
e Optionally, click Save As to save the new search conditions as a filter for future reuse.
3 On the toolbar, select a layout from the Layout pull-down list. (This feature is available only for a report resource with multiple report definitions.) The default layout is listed in bold text.
4 On the toolbar, select an output format from the pull-down list before the Run button. You can choose from several output formats when the report is run:
• Document — The report is displayed in the Report Viewer window.
• PDF — The report is rendered as a PDF file. You can save the file and open it in the Report Viewer window.
• PDF Read-only — The report is rendered as a read-only PDF file. It has a random password that prevents tampering with the document.
• TIFF — The report is rendered as a Tagged Image File Format (TIFF) file.
• RTF — The report is rendered as a Rich Text Format (RTF) file. You can open this file in Microsoft Word and save it in .doc format.
• Excel — The report is rendered as a Microsoft Excel (.xls) file. You can save the file and open it in the Report Viewer window.
• Plain Text — The report is rendered as a plain text (.txt) file.
5 On the toolbar, click Run. A report generation progress bar appears. When report generation is complete, the report is displayed in the Report Viewer window directly or opened as a PDF or Excel file depending on which output format you selected. For some formats, you can click Save to create a file of the specified type in a directory on your file system.