Value Stream Mapping
Review: what is a Value Stream and what is a Value Stream Map?
A value stream is the set of activities, both value-adding and non-value adding, that occur in taking a product from concept to launch, from order to delivery, from raw material to finished product.
Value stream mapping (of the production value stream) develops a kind of graphical diagram, showing each activity that occurs in the flow of material from the supplier to the customer as well as the information flow from the customer back to the production floor and the supplier and a lead time diagram contrasting value-adding time to elapsed time.
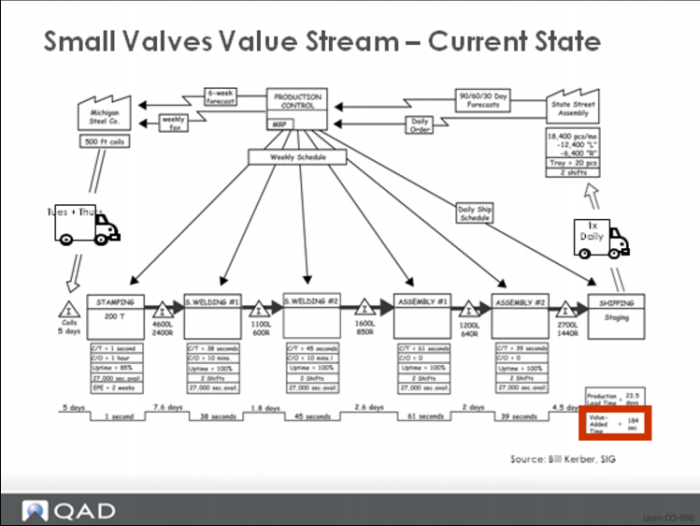
Small Valves Value Stream - Current State
Value stream mapping is an essential lean technique which, like many others, was originally developed at Toyota. It has been disseminated and popularized by the book Learning to See by Rother and Shook. It is a core element of a lean transformation because it provides a basic blueprint for the kinds of changes needed to move from a disconnected, dysfunctional flow kind of environment to one where material flows smoothly from one process to the next to the next, rather than making isolated improvements to individual activities within a larger value adding process. Value stream mapping provides an overall structure for applying other tools and kaizens, and for seeing beyond the symptoms of waste to real root causes.
An example of a current state value-stream map is shown above, and an envisioned future state is shown in the next image. (These figures are reprinted with permission from Lean Standard System, Christopher Gray, Trafford Publishing, 2008.)
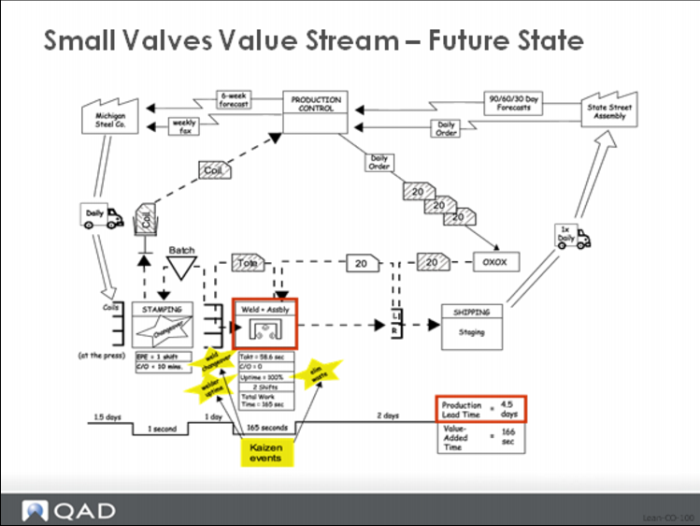
Small Valves Value Stream - Future State
Elements of a Value Stream Map
A value stream map has three essential parts:
• Information Map—shows the basic flow of data from the customer to the production control/planning function to the production floor and back to the suppliers.
• Material Flow Map—shows the flow of material from the supplier(s) to the production floor and each of the manufacturing processes and inventory points and then on to the customer.
• Lead Time Ladder—compares the amount of time spent in value-adding activities to the total elapsed time for products produced in the value stream.
Information Flow
In the value-stream map which depicts the current state of the value stream, observe the flow of data (Information Flow) at the top of the map. Here the customer communicates daily requirements to the production control organization via an electronic signal (fax, email, EDI, etc.). These are converted to schedules for each plant process on a daily basis, and once a week they are converted to supplier orders. This is a fairly traditional, mass production method of determining and communicating factory and supplier requirements. Each discrete process is scheduled, often by a computer scheduling system that attempts to keep up with changes in the manufacturing environment. These changes would include changes in customer delivery schedules, as well as scrap, rework, inventory adjustments, engineering changes, and so on. The schedule itself in this case is a daily dispatch list, although it could also be reissued each shift or partial shift.
Material Flow
The Material Flow portion of the map (the large block of boxes and triangles in the middle portion of the diagram) depicts the movement of product from raw material to finished goods. The boxes depict individual disconnected manufacturing processes, data about which can be found immediately under the individual boxes, and the triangles represent inventory which has accumulated between the process steps and is waiting for processing in a subsequent process. The data boxes for each process record key production information such as cycle time per piece, setup time, production interval, number of operators, downtime, scrap rate.
Immediately below the inventory triangles in the Lead Time Ladder portion of the map is an estimate of the amount of inventory expressed in time units based on takt time for the finished products produced in this value stream. For example, if the takt time is 1 unit each 30 seconds and there are 1000 units sitting between two processes, it will take 30,000 seconds or approximately 8.3 hours before the inventory is used. Or another way to think about it is that any new material arriving from the feeding process will have to wait for about 8 hours before it will be consumed.
Lead Time Ladder
The Lead Time Ladder summarizes the cycle times (value-added time in each process) per piece and contrasts this with total time spent in the value stream. Total time reflects both value-added time and the time spent waiting as inventory between processes. Upper steps are wait time, and the lower steps on the later are value-adding time. At the far right, you can see the total of each of these types of lead time as well as the sometimes shocking difference between the two values.
Refer to Learning to See for definitions of all the mapping icons commonly used in a value stream map, or refer to the reference material near the end of this course.
Current State or Future State?
Value stream maps normally exist in pairs (or triples): the current state map along with one or more future state maps. Generally speaking future state doesn’t mean far distant or far future state; instead they are meant to depict stages of improvement that can be reached in three to six months. In many cases a company will want to layout a year or more worth of work, so two or more future state value stream maps, each building on the earlier map, can exist.
For example, the value stream maps in previous images depict the current and future states for a gear assembly value stream. The star bursts on the future state map show the key improvements that will be required to enable the changes in information and material flow. The major change in information flow is to replace the traditional computerized scheduling logic with a pull system: scheduling only the assembly operation based on customer orders and pulling all material from upstream processes using kanban signals. The principal changes to the material flow, in this case, are to:
1 Combine work processes into cells as much as possible.
2 Determine the production interval for each new cell and reduce the lot sizes to reflect it.
3 Create managed supermarkets of component and finished product inventory and eliminate the inventories between work processes as much as possible.
4 Replace the weekly fax based ordering and delivery process to the suppliers with a daily kanban signal for ordering and a daily delivery of material.
5 Level the schedule at the pacemaker process so that demand being passed back through the value stream is as constant and repetitive as possible.
The effect of these changes can be observed in the Lead Time Ladder at the bottom of the future state map. Here, with virtually no changes to cycle times in the process, lead time drops from <x> days to <y> days: a <z>% change in lead time overall, a major improvement in product flow, and a corresponding drop in inventory investment.
Uses of the Value Stream Map
The major uses of value stream mapping can be summarized as:
It provides a big picture of material flows, without which the tendency is to work on improving individual processes (milling, drilling, hardening, etc.) rather than on improving the overall value stream.
It allows the manufacturing, materials and supply chain organizations to be structured around value streams rather than individual processes or functions. For example, rather than having individual people responsible for each process in the plant, a single person can be held accountable for the performance of an entire value stream and limited resources can be focused on eliminating the sources of waste, variability, and strain.
It provides a common view for operations and accounting and becomes the basis for discussing real improvements.
It makes the impact of decisions apparent in a quantitative way—in the Lead Time Ladder—rather than as spongy, feel good notions about what might happen.
It connects information flows and material flows.
It can become the basis for an implementation plan or series of implementation plans.
And from the context of the QAD Lean software, the value stream map becomes the basis for modeling processes and kanban loops so that the system can assist in some of the important calculations like takt time, EPE Interval, leveling and loop sizing. To use the software effectively, and to model your value streams in a sensible way, you’ll need to do a value stream map first.
In the next section we’ll see how takt time is used to set the drumbeat for all production and purchasing replenishment activities across the entire value stream.