Kanban Planning and Loop Sizing in QAD Lean
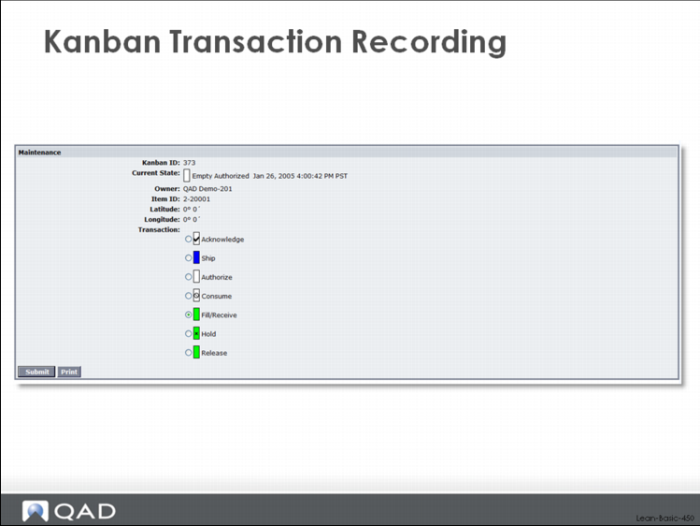
Kanban Transaction Recording
In this part of the class, we’ll look at the basic functions for setting up the pull system, sizing kanban loops, and creating the appropriate number of kanban cards. Specific functions we’ll look at include:
• Average Daily Demand Calculations
• Safety Stock Calculations
• Kanban Workbench
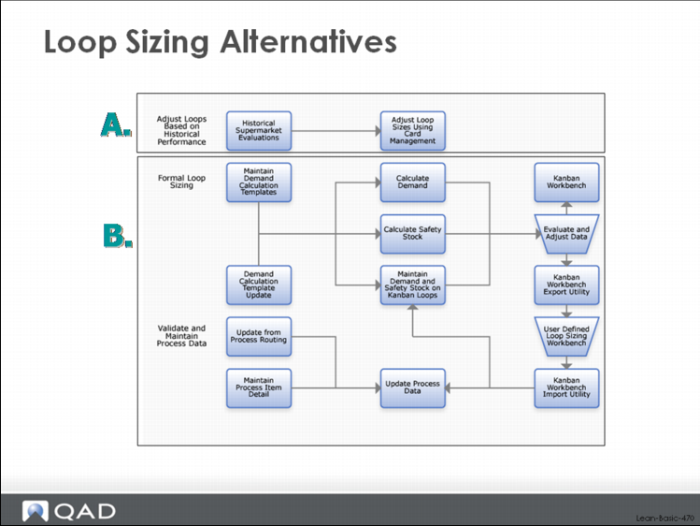
There are two competing schools of thought regarding kanban loop sizing.
The empirical (or experimental or observational) method relies on adjusting the inventory buffer or loop size based on its observed performance over time. If the item is experiencing too many stockouts then perhaps the amount of inventory in the loop should be increased. If the inventory for the item never dips below a certain value (for example it never goes below the level of the safety stock), then maybe the level of inventory should be decreased. This observational method is described in Kanban: Just in Time at Toyota. Bill Sandras explains a similar observational method in his book Just-in-Time: Making It Happen, which he describes as one less at a time.
The theoretical method is based on a simple mathematical model of inventory behavior based on statistical inventory management principles. The amount of inventory in a loop should be based on the demand during the replenishment time, safety stock, and the order quantity. In this method, when average demand increases or decreases, when replenishment time changes, when the amount of demand variability is greater or smaller, and as the order quantity is adjusted because of process and standards changes, the loop size should be altered.
Loop Sizing Alternatives
Both methods are supported in QAD Lean and are pictured above.
Which is better? Should you use the empirical or the theoretical method of loop sizing?
The truth is that there is no best method. What works for you—or even how you combine the two methods to work together—might be different from what works for other companies. Suffice it to say that if you are just getting started, you’ll probably want to size your loops initially based on the theoretical method that models your demand and production process. For many companies, getting an appropriate lot size—neither so small that they run out of capacity because of excessive numbers of set ups nor so large that lead times are extended and excess inventory generated—is a key issue that can’t be dealt with easily. The theoretical loop sizing method takes the element of emotion and argument out of the process. Once loop sizes are set and the process has been stabilized and made routine, then it might be appropriate to phase in some element of the empirical approach.
In this section of the class, we will look at the theoretical method of loop sizing, returning to the empirical method in a later section.
Assumptions of the Pull System
One of the fundamental assumptions of a pull system is this: relatively constant and uniform demand. The core idea of pull—replace what was used—depends on having relatively stable and steady demand. While it is possible to buffer demand variability somewhat through the selective use of safety stock, something we’ll discuss in this chapter, the basic logic of the system is to plan based on an average demand level. As demand changes over time, the average demand needs to be recalculated and this can happen as frequently or as infrequently as required. It is certainly possible to recalculate average demand, and the associated kanban loop sizes, on a daily basis although it is probably more common to do it weekly or monthly.
Average Daily Demand Calculations
The calculation of average demand in QAD Lean can be done in several different ways:
• Using a kind of gross requirements calculation, sometimes called a summarized explosion or quick deck explosion, which looks at future forecasts, customer orders, and distribution demands, and explodes them through the bill of material without considering on-hand inventories or quantities on order. As you might guess, if you have past due customer orders, they will still be included in the average demand calculation. Past due forecasts will also be used, back to the limit defined by the MRP forecast consumption parameter. The horizon used for the calculation is specified via a parameter, and can vary by part or group of parts.
• Using the average usage based on inventory issue transactions from transaction history. The horizon used for the calculation is specified via a parameter, and can vary by part or group of parts.
• A blend of the two. The horizons used for the calculation are specified via a future days and a past days parameter, and can vary by part or group of parts.
For each kanban loop you need to decide: should the demand be based on historical demands or future projections? Maybe historical usage reflects demand more accurately than future forecasts and customer orders. Or perhaps future demands are a reasonable reflection of what’s likely to happen, but only over a very short horizon.
In these cases you may want to use the historical usage as the basis for the average daily demand.
Or it could be that you only want to look at future demand, because history is irrelevant for these parts that you're producing. This would be especially true for a new part, for a part that experiences significant seasonality, or is part of a significant new product introduction/ramp up or a significant product phase out/ramp down.
Or you might want to use a little bit of both: some history to reflect actual usage and some future demands to pick up trends in the forecasts and actual customer orders. In QAD Lean, you specify both the historical and future horizons for the demand calculation, and this can be different from one part to the next.
And regardless of what you decide, the average demand on any given kanban loop must reflect the average demand for the part AND the percentage of demand that is filled from that specific loop. For example, final assembly can move material to a shipping supermarket and it can also move the same part to another supermarket that is part of a company distribution network. Historical demand (the transfers of inventory from the specific supermarkets) will reflect the exact usage of the part. But demand in the future is calculated for the part and then prorated based on what percent of the total typically goes to the specific supermarket.
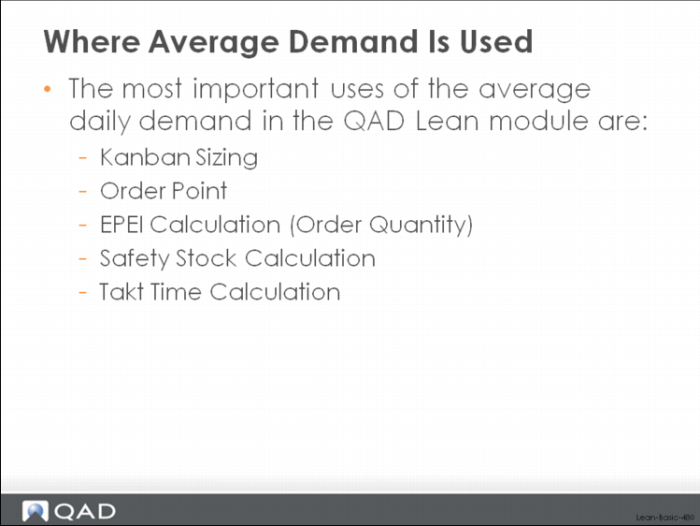
Where Average Demand Is Used
In a case where 50% of the demand goes to one supermarket and 50% goes to the other, the appropriate percentage would be loaded to the kanban loop record (the demand percent in the loop) and this data would be used in calculating average daily demand.
So why is average daily demand calculation so important to these lean functions? Why not simply set the average daily demand manually for each kanban loop?
QAD Lean will allow you to manually set average daily demand on each kanban loop. Simply use the Kanban Master Maintenance function in the system. However, as with any data that is set and maintained manually, there is usually a significant effort required to develop and maintain the data. In some cases that means that the data will not be updated as frequently as it should, and in other cases that means that it will not be as accurate as it needs to be.
For kanban sizing, the average daily demand drives both the order point and the order quantity calculations.
1 The basic order point calculation (order point = demand during replenishment lead time plus safety stock) uses the average daily demand directly in determining demand during replenishment lead time, and indirectly in cases where safety stock has been calculated from demand variability. A comprehensive order point calculation also uses the average daily demand in its calculation of FIFO stock (demand during the FIFO lead time) and in its calculation of demand during a fixed ordering interval in a variable quantity/fixed kanban system.
2 For manufactured parts the average demand will also contribute to the order quantity calculation. This is because the average daily demand is a key input to the EPE Interval calculation, and the EPE Interval is the most important factor in setting the order quantity. The lot size or order quantity must be large enough to cover the demand during the production interval (EPE I).
Average daily demand is a key input to the statistical calculations of safety stock in the system, because both of the calculations involve a measurement of demand variability based on average demand. The so-called simple method for calculating safety stock computes the average demand variability over time, and then, based on a user specified service level, determines how much safety stock is required. In the peak method, the safety stock is set to the difference between the largest observed peak demand and the average demand.
Finally, the average daily demand is an input to the takt time calculation in the system. Takt time for a process is the normal working time per day divided by the total average daily demand for all the parts produced in the process. This is the drumbeat of production that must be met to synchronize with customer needs.
Demand Templates Determine the Method, Horizon, and Loops
The average demand functionality in QAD Lean is built around the idea of demand templates that specify the calculation method and the horizon parameter and that can be assigned or reassigned to different kanban loops. For example, one user might set up a demand template called FUT30 that specifies the gross requirements calculation over a 30 day forward horizon, and assign this template to all of his parts. Another user might set up a template called PAST20 that specifies using historical usage over 20 past days, and assign this template to most or all of his parts.
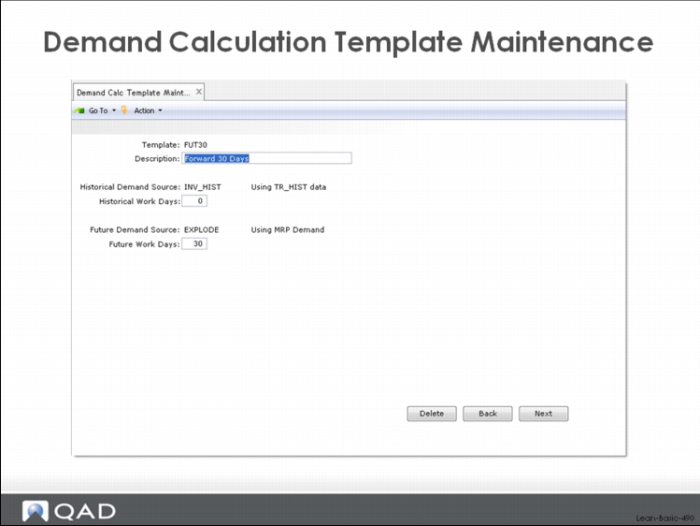
Demand Calculation Template Maintenance
An example of the demand template for Fut30 is shown above.
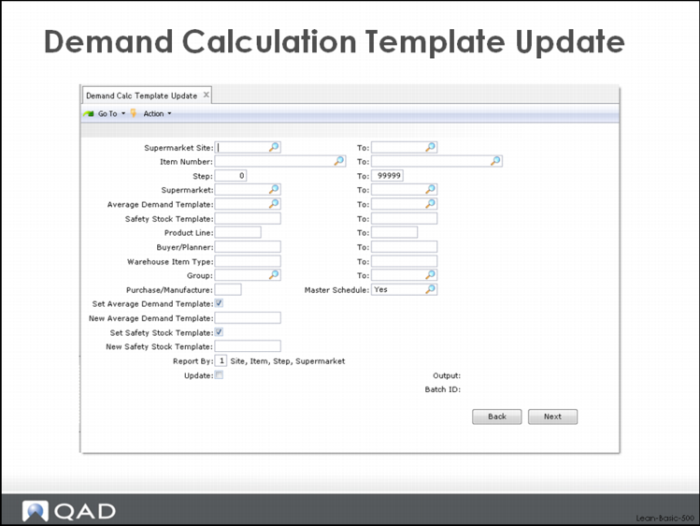
Demand Calculation Template Update
Once templates have been set up, they can be assigned to individual items through Kanban Master Maintenance, or a group of items can be mass updated using the Demand Calculation Template Update, shown here. The selection criteria in this display work in the normal way and along the lines of other selection screens in QAD Enterprise Applications.
The user can select kanban loops based on:
• A supermarket site or range of sites for the destination supermarket
• An item number or range of item numbers
• A step or range of steps
• A destination supermarket or range of supermarkets
• The parts that have been assigned an existing demand template or range of templates.
• The parts that have been assigned an existing demand template or range of templates for the safety stock calculations.
• A product line or range of product lines.
• A buyer/planner or range of buyer planners.
• A warehouse item type or range of types.
• A group or range of groups.
• A particular category (purchased or manufactured) of part.
• The master schedule code.
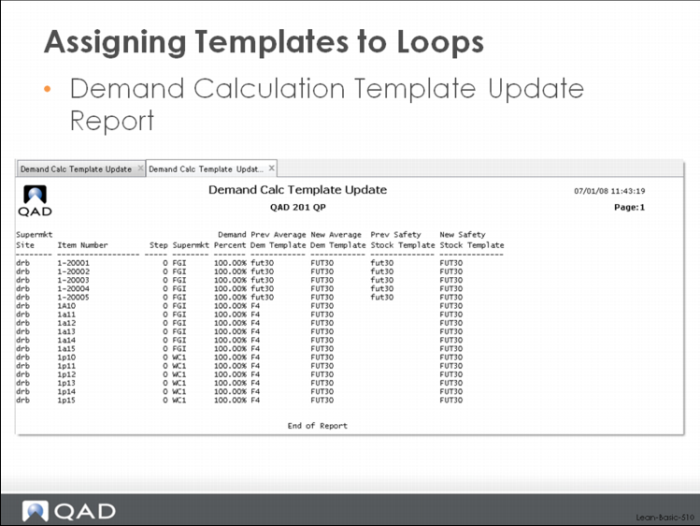
Assigning Templates to Loops
Additional functionality exists to assign templates for safety stock and average demand calculations based on the selection. Check the Set Average Demand Template and/or the Set Safety Stock Template boxes and specify the appropriate demand or safety stock template to be used in the calculations for the set of selected parts. If you check the Update box, then the system will actually update the loop records for the selected parts. Otherwise the Demand Calc Template Update will operate like a simulation and no updating will be done.
The system produces this audit report (regardless of whether the update was done or not)