Running the Average Demand Calculation
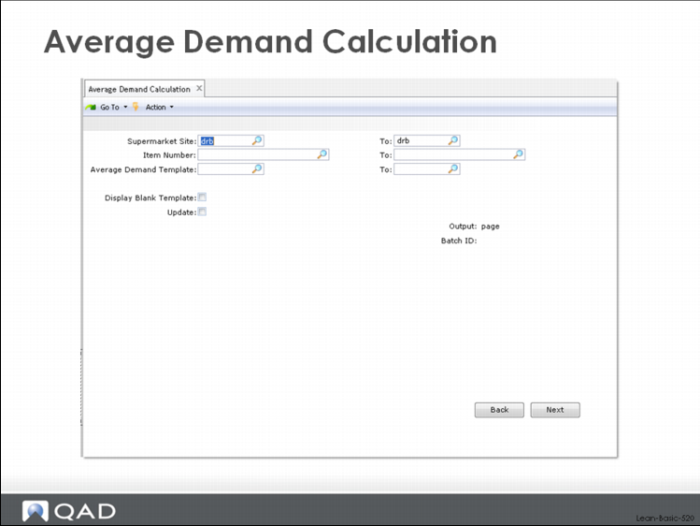
After templates have been assigned to individual items, it is possible to calculate average demand:
Here the user can specify a supermarket site or range of sites, an item number or range, or a template or range of templates. The Update check box controls whether the system updates the database or simply prints an audit report showing what would have happened:
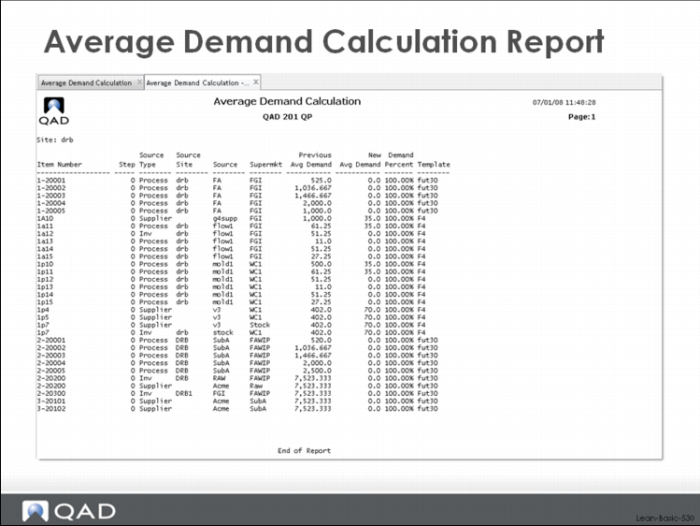
Average Demand Calculation Report
The Update control in the average demand calculation allows you:
Assess the magnitude of a demand change before changing the system and resizing kanban loops.
Do what if analysis and look at different calculations of demand before committing to a specific number.
Review the data and look for obvious errors or problems before kicking off a whole series of downstream processes.
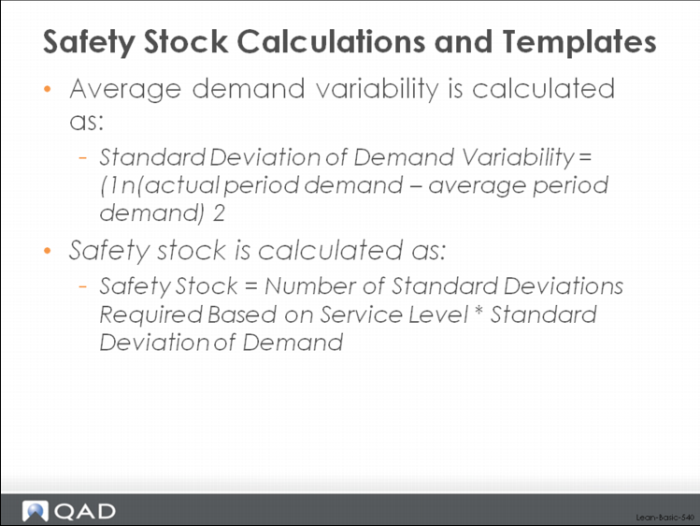
Safety Stock Calculations and Templates
The same basic functionality for assigning templates to individual items or groups of items, and for running the average demand calculations for a range of parts also applies to the safety stock calculations in the system.
It’s worth noting that, at the present time, only items with independent demand (forecasts or customer order) are included in the safety stock calculation. If you want safety stock on items with only dependent demand, you must set it manually.
The way the safety calculation works is based on parameters associated with the loop such as safety stock method—either statistical, peak or average—and required service level. In the simple safety stock method, the system does a traditional statistical safety stock calculation based on variability and specified service level. (See image above)
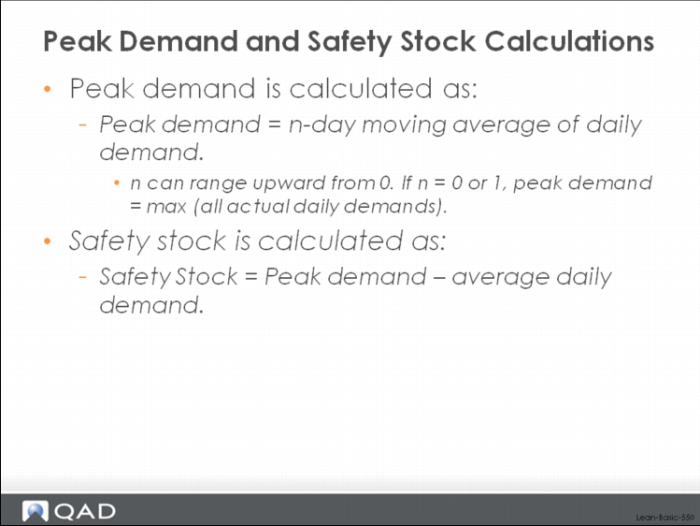
Peak Demand and Safety Stock Calculations
The idea here is that you are trying to set safety stock based on some customer service level you've decided on, and are basically saying given this amount of demand variability how much safety stock would I need to carry to get X% customer service?
Of course, as you probably know, there’s no amount of inventory that can guarantee 100% customer service. But what about 98%? Or 95%? You can set your service level to whatever value you feel is appropriate, and the QAD Lean module will calculate the amount of safety stock needed to support that, assuming only that you have a normal, statistically unbiased statement of demand.
In the peak safety stock method, the system does a slightly different kind of calculation and one that is less sensitive to whether your forecast is biased. The peak calculation determines the difference between peak demand and average demand. See image above.
The rational for calculating an average peak based on an n-day moving average is that even though the peak demand appears on a specific day, often there is an allowable response time for dealing with that demand. For example, many companies use their replenishment lead time as an approximation of the typical or allowable response time. By doing this, the magnitude of the pure peak demand is reduced and less safety stock is required to meet it.
Say for instance, you want to look at average demand over the past two months compared to the maximum peak demand by week. In this instance you might have average daily demand of 50 but a maximum average peak of 75. Therefore you would need to carry 25 units in inventory as a safety stock to make sure you cover typical variations in demand.
The Kanban Workbench in QAD Lean is a comprehensive function for determining the size of kanban loops based on demand, lead time, safety stock, cycle and setup time, fixed and variable ordering intervals, and other logistics constraints. It is an interactive tool that can be run in simulation mode, and then saved back to the main database. This way you can simulate changes to the loop sizing factors, see the impact, adjust, etc. until you are happy with the results and choose to save and update.
Often the earlier adopters of pull systems struggled with loop sizing. How do we ensure that we have enough inventory in the loop to maintain some semblance of flow? How small can our lot sizes be before we start running out of capacity from too many setups? What about purchased parts on fixed ordering intervals? How should we size those loops? What’s the inventory investment we’re making if we commit to some set of loop sizes? How many times will we really setup each week? How much safety stock is being generated by our choices of container or kanban quantities? What kind of load do we generate on our processes? All these questions, and more, are ones that need answers.
To get answers, users of kanban have frequently built sizing workbenches using MS Excel, and have often gotten good results from this approach. But sometimes, because Excel is such a well known tool, and so easily modifiable, different kanban planners in the same company will often have different workbenches with different logic for sizing their processes and associated loops. Add to that the problem of getting data out of the manufacturing database and back in after being run through the Excel workbench and you can see some of the problems that these users faced.
The Kanban Workbench in QAD Lean was specifically designed as a general purpose, standardized function that included the normal logic for kanban loop sizing and was connected directly to the QAD Lean database. The idea was to move the loop designers out of spreadsheet design and data entry into usage. This way the kanban planners can spend more time focusing on what's the best size for my kanban loop rather than on does my spreadsheet have the correct logic and did I get the data in correctly.