Kanban Workbench
Retrieves data from QAD Lean as input to user developed Excel workbenches, and subsequently updates the QAD Lean database after user sizing calculations are saved.
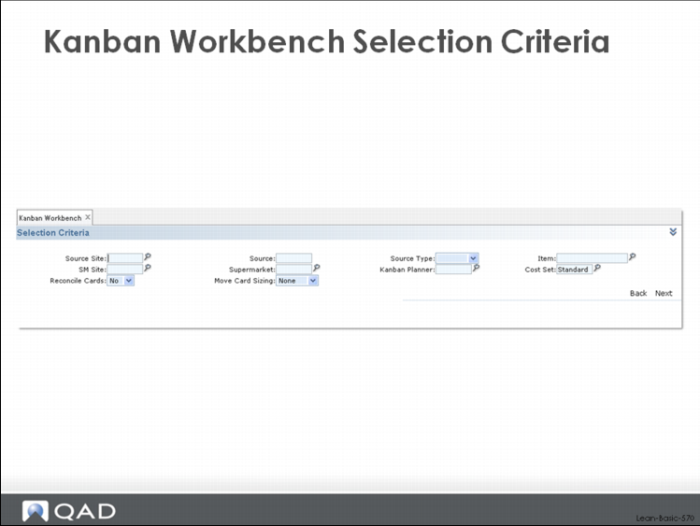
Selection for Sizing
A user can select loops associated with a particular source (process, supermarket, supplier), loops whose destination is a particular destination supermarket, loops associated with a particular planner, loops for a particular item or part, or an individual loop. This is done using the selection criteria screen shown above.
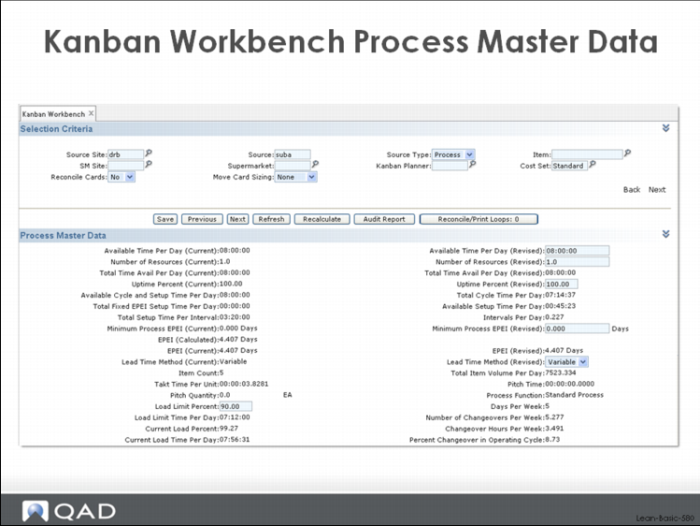
Kanban Workbench Process Master Data
After selection, the system will return a multi-frame workbench that includes:
• Process Master (summary) Data, including the calculated EPE Interval (source = process only)
• Process Detail Data, including cycle and setup time, yield factor (source = process only)
• Sizing Data
• Analyst Data
The Kanban Workbench Process Master Data frame, shown above, displays the key process data (time in a normal day, number of resources, uptime, etc.) as well as the essential calculations for the source process. These include the EPE Interval, takt time, current load time per day versus load limit, number of changeovers in one week, changeover hours per week, changeover expressed as a percentage of time in the EPE Interval.
Arguably the most important calculation, at least from the perspective of kanban loop sizing, is the EPE Interval calculation. The Process Master Data displays the elements of this calculation (available time in a day, cycle time per day, fixed setup time per day because of item EPEI overrides, net time available for setup per day, and total setup time for all other parts). These are used in the calculation to get the smallest possible production interval. This can be overridden by the user in cases where it makes sense to run to a larger interval. The override can be specified in the Minimum Process EPEI.
Data in the blue boxes can be changed so that you can simulate the effects of changes to the process. This is where you can add or reduce the time in a normal day, increase or decrease the number of machine resources, increase or decrease the uptime in the process, override the EPE Interval by specifying a minimum process EPEI, and control whether you want replenishment lead times calculated automatically or not.
Notice the control buttons located between the selection criteria and the process master data. These allow you to save data back to the live database, refresh the data in the workbench from the live database, produce an audit report of changes you’ve made, and reconcile your kanban cards based on the new loop sizing. The next and previous buttons will move you through the detailed loop data twenty records at a time. If you change any of data values in the workbench and then save the results back to the database, your changes will be stored and become the permanent values used in subsequent sizing and other calculations. If you refresh without saving, then the system will discard your changes and return the original (last saved) data from the database to the workbench.
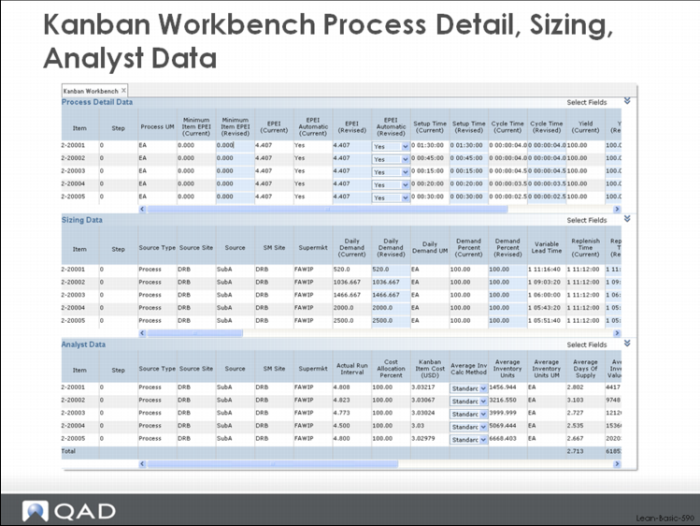
Kanban Workbench Process Detail, Sizing, Analyst Data
The Process Detail Data frame, shown above, provides process detail data like item EPEI overrides, setup and cycle times, yield factors, and adjusted daily demand considering the process yield.
You can maintain the key Process Detail Data fields here in the workbench. Available for updating are:
• Minimum Item EPEI
• Setup Time
• Cycle Time
• Yield Factor
You can use these fields for initial data loads or for making minor adjustments, or for simulating the results of kaizen events that you may have underway or in planning.
Many companies use the workbench as a kind of mass maintenance function in the system. Instead of loading setup time, cycle time, and yield factors using the Process Item Detail maintenance screens, they update the data here. For example, you can move up and down columns of data, tab from one field to another, key data directly or copy and paste, etc. as a way to quickly update these data fields. The data will be used by the workbench immediately, and when you hit the save button you can save it back to the database.
The Sizing Data frame (also shown) shows the balance of the basic data needed for loop sizing, as well as the details of the loop sizing calculation.
For each loop, the key details include:
• Average daily demand (assumes you’ve updated this before running the workbench, either manually or using the average daily demand calculation in the system).
• Demand percent
• Lead time elements (replenishment time, internal and external FIFO time)
• Replenishment lead time
• Calculated demand during lead time
• Safety stock
• Safety time
• Variability factor
• Calculated order point
• EPE Interval
• Calculated order quantity
• Units per kanban
• Final order point
• Final order quantity
• Maximum inventory (order point plus order quantity)
• Number of order point cards
• Number of order quantity cards
• Total cards
• Current card total
• Change in number of cards from sizing
The basic idea of the kanban sizing logic in the system is to determine how frequently you can set up (the EPE Interval) each item, how much inventory is needed in the loop as a way to cover the interval between setups as well as the lead time between replenishments, what the effect of packaging might be, etc. It’s one thing to say that the order quantity is ten, but if the packaging quantity is 25, then the kanban loop will need to be sized for that consideration (or the package size needs to change). An even with safety stock, you also have to have enough inventory in the loop to cover your order quantity, the time that it takes you to produce your order quantity, the time it takes to go through the FIFO lane, and any transit times or wait times. A fixed ordering interval arrangement with your supplier adds another consideration.If you communicate your needs to the supplier every hour, the loop requires substantially less inventory that if you communicate weekly.
You can maintain the key Sizing Data fields here in the workbench.
Available for updating are:
• Average daily demand (assumes you’ve updated this before running the workbench, either manually or using the average daily demand calculation in the system).
• Demand percent
• Replenishment time
• Internal FIFO time
• External FIFO time
• Safety stock
• Safety time
• Variability factor
• Packs per kanban
• Card reporting control
• Fractional kanban control
• Order quantity multiple (in cards)
• Card reconciliation control
• Run out option
You can use these fields for initial data loads or for making minor adjustments, or for simulating the results of kaizen events that you may have underway or in planning. Many companies use the workbench as a kind of mass maintenance function in the system. Instead of maintaining these fields individually using Kanban Master Maintenance, or in the case of the demand and safety stock through the batch processes, they update the data here. For example, you can move up and down columns of data, tab from one field to another, key data directly or copy and paste, etc. as a way to quickly update these data fields. The data will be used by the workbench immediately, and when you click the Save button you can save it back to the database.
The workbench provides a summarized analysis for benefit of the kanban planner/loop designer. This analysis is shown in the Analyst Data frame of the workbench.
The Analyst Data frame helps the kanban planner understand the impact of his or her decisions on things like inventory investment, safety stock levels, actual production intervals, and loading. By simulating different conditions the kanban planner can choose the optimal loop sizes.
Shown for each loop, and in many cases as an overall total:
• Actual run interval
• Average inventory
• Average coverage
• Average inventory investment
• Safety stock and safety time
• Container generated safety stock
• Total safety stock investment
• Safety factor based on safety stocks and loading
• Loading statistics
This data allows for more precise control and management of inventory and your manufacturing assets. For example, safety stock, while providing an important function in the system, is sitting inventory and often represents money that can be better spent elsewhere. By calculating the real amount of safety stock that you are carrying, you're managing your investment and your inventory dollars, and perhaps improve overall inventory flows at the same time.
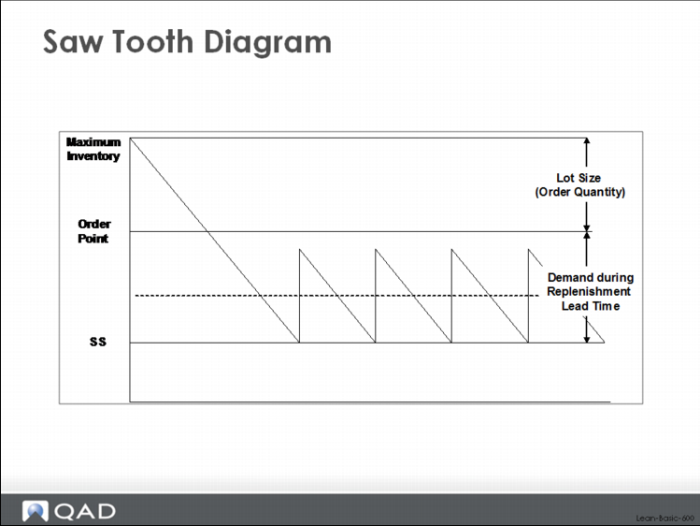
Saw Tooth Diagram
In this frame you can maintain the Average Inventory Calculation control which determines how the average loop inventory is calculated in the system. The standard calculation (Standard) models a typical saw tooth diagram like the one shown in the diagram above. (Note that the diagram below is showing the behavior of the supermarket inventory only; it does not model total inventory behavior like the Average Inventory Calculation. However, the basic concept remains the same: inventory oscillates back and forth in kind of a sawtooth way.) The alternative calculation (MFG1) is a more complicated calculation that attempts to model inventory behavior accounting for the fact that all the material is not received into the supermarket all at the same time. If you change the control, the new value will be used by the workbench immediately, and when you hit the save button you can save it back to the database.
The example above for process SubA illustrates how a kanban planner might use the kanban workbench to evaluate process changes that might benefit the company. An astute kanban planner probably would look at the EPE Interval for SubA (4.4 days), and without looking at anything else, conclude that there was a big opportunity in the cell. By looking at the analyst data for the cell, he or she might get a sense of the financial opportunity—a substantial inventory savings from the current level of $61,000.
But the question is: what is the best way to reduce the EPEI and achieve a savings?
• The bucks and bodies solution is one alternative. Add overtime or additional resources (machines or people) and the EPE Interval will be smaller but there will be a cost in labor or equipment.
• Speeding up the process—improving the cycle time—is another alternative but probably has minimal effect.
• Reducing setup on one or more of the items being produced will often improve the interval, especially when the setups are large.
• Running one or more of the items at a different frequency (overriding the EPE I selectively by item) will change the interval and may result in overall lower inventory depending on how it is done.
The workbench is a tremendous help in managing the number of loops that you need to design and maintain. However, many times users have already invested a lot of time and effort into building their own Excel spreadsheets to provide these same functions. Here there might be similar, comfortable tools but no easy way to get the data from the core ERP system into the spreadsheet, or back out when the sizing is over.
QAD Lean provides functions to help with this problem. Specifically, the system provides an export program that you can export the data and load that into your Excel spreadsheets, and an import program to get the data out of the Excel spreadsheet and import it back into QAD Enterprise Applications. To use these functions, all that is required is that you modify your spreadsheets to:
• Read the imported data from a specifically formatted comma delimited format.
• Write data that is coming back to QAD Lean to a specifically formatted comma delimited format.