Kanban Management and Tracking
In this section of the class we’ll look at:
• Kanban Transactions and Advanced Inventory Updating
• Ship/Move – Scrap Reporting
• Fill – Scrap Reporting, Inventory Receipt Override, Location Override
Kanban Transactions and Advanced Inventory Updating
These changes have not been merged into the software being delivered to customers today. When this functionality is available in the Demo Center, then this section of the class will be updated to reflect it.
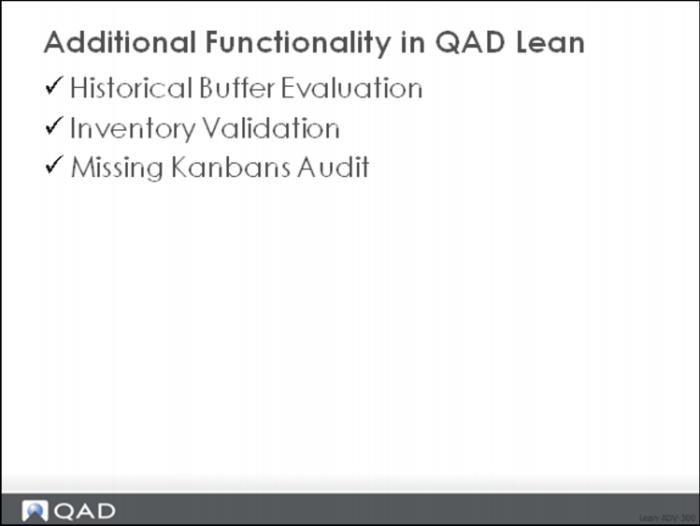
Additional Functionality
Historical Buffer Evaluation
In this part of the class, we’ll look at an alternative method for sizing kanban loops, and for adjusting the number of kanban cards circulating in the pull system. Specifically we’ll look at a function called the Historical Buffer Evaluation.
As explained in an earlier section of the class, there are two competing schools of thought regarding kanban loop sizing.
Empirical Method
The empirical (or experimental or observational) method relies on adjusting the inventory buffer or loop size based on its observed performance over time. If the item is experiencing too many stockouts then perhaps the amount of inventory in the loop should be increased. If the inventory for the item never dips below a certain value (for example it never goes below the level of the safety stock), then maybe the level of inventory should be decreased. This observational method is described in Kanban: Just in Time at Toyota. Bill Sandras explains a similar observational method in his book Just-in-Time: Making It Happen, which he describes as one less at a time.
Theoretical Method
The theoretical method is based on a simple mathematical model of inventory behavior based on statistical inventory management principles. The amount of inventory in a loop should be based on the demand during the replenishment time, safety stock, and the order quantity. In this method, when average demand increases or decreases, when replenishment time changes, when the amount of demand variability is greater or smaller, and as the order quantity is adjusted because of process and standards changes, the loop size should be altered.
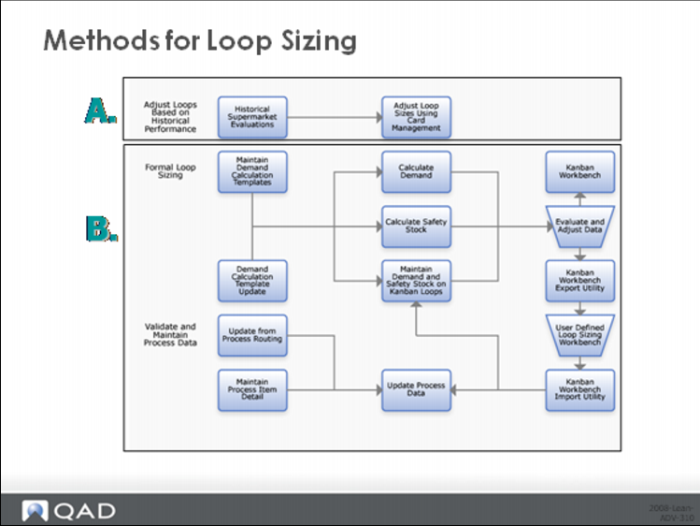
The next images show the two methods:
Methods for Loop Sizing
The Historical Buffer Evaluation in QAD which is part of method A above provides an analysis of actual inventory performance over time so that you can determine whether the level of inventory is sufficient or in excess of what is needed and then increase or decrease the amount of inventory you are carrying in the loop.
The logic of the system is based on some limits that you set up in each kanban loop in the system. The critical limit defines the inventory level where you are risking a stockout on the item. This can be based on an inventory quantity or the percentage of the maximum buffer quantity. Similarly, the warning limit defines an excess inventory point; if the actual inventory never drops below this point then the buffer should be reduced. Again this limit can be defined as an inventory quantity or as the percentage of the maximum buffer quantity.
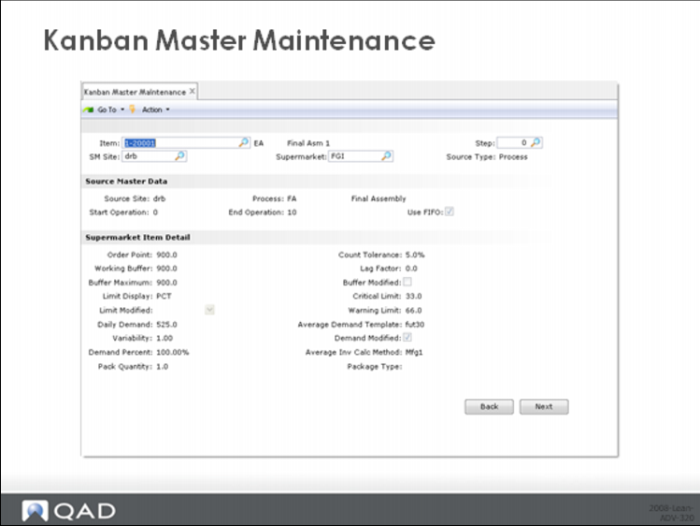
Kanban Master Maintenance
The limit values are set up in the kanban loop using the Supermarket Item Detail frame of the Kanban Master Maintenance function of the system, an example of which is shown above:
As a starting point, many companies will set the critical and warning limits as a percentage of the maximum buffer quantity, often 33% and 66% respectively. Over time they might want to change the limits to a specific quantity for each loop, perhaps the safety stock quantity and the order point quantity for the item for example.
The logic in the system used to evaluate buffer performance, which is based on a comparison of actual inventory based on full kanbans and the limit values, is this:
1 Over the period specified, check the number of times that inventory has dropped below the warning limit. If the inventory has never dropped below the warning limit, then arguably the buffer maximum is set too high and should be reduced. For example, if you set the warning limit to equal the order point quantity and the inventory never actually reached the order point then you are probably carrying too much inventory. Or, maybe a more realistic situation; if you set the warning limit to equal the safety stock but you never actually dipped into the safety stock then you probably can safely reduce it.
2 Over the period specified, calculate the accumulated exposure to stockout and compare this accumulated value to the critical limit. The accumulated exposure to stockout is the sum over all the days in the period of the difference between the critical limit and the actual inventory, if the actual inventory is less than the critical limit. If the accumulated exposure to stockout is greater than the critical limit, even if you’ve never actually had a stockout, then the system suggests that you might be carrying too little inventory and gives you an opportunity to increase the buffer maximum. As an example, if you set the critical limit to the safety stock quantity, and had exposures to stockout greater than the safety stock quantity then you might want to increase it. Or if you set the critical limit to be one kanban’s worth of inventory then you would get a warning if you ever emptied all the kanbans in the loop. (Notice again that this doesn’t mean that you stocked out, it just means that you had a greater exposure to a stockout.)
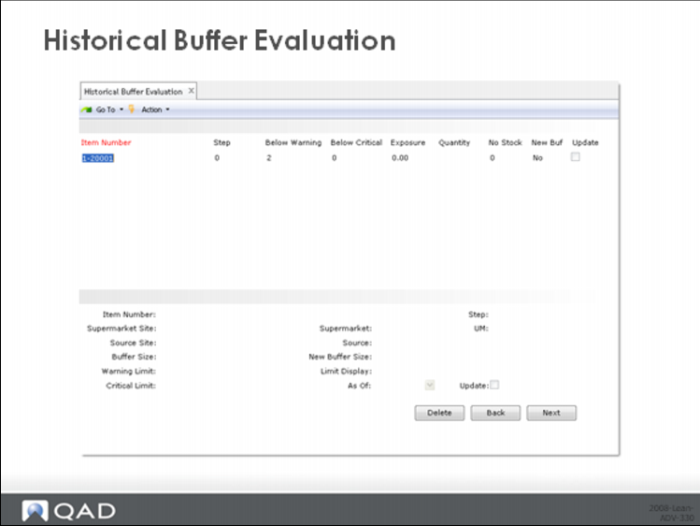
Historical Buffer Evaluation
The Historical Buffer Evaluation display shows the detail of the analysis done against each item, and an exception indicator New Buffer to show the loops that are candidates for updating based on the buffer analysis logic. Check Update and the system will provide access to the maintenance frame at the bottom of the display. Here you can change the maximum inventory buffer (New Buffer Size) or the limits themselves (Warning Limit, Critical Limit).
There are several things you should recognize about the Historical Buffer Evaluation:
1 The logic of the analysis was based on a periodic evaluation at consistent fixed intervals of time. The system designers felt that 30 days was appropriate for the time between evaluations. However, you can use a longer or shorter period if it suits you.
2 You can get odd results if you run the analysis, adjust the buffer size and them immediately rerun the analysis. This is because the new analysis will be done against the new buffer size, even though this buffer size was not actually being used in the loop during the period being analyzed. Consequently if you change the buffer size then you should wait for the appropriate amount of time (30 days or some other value of your choosing as described in point 1 above) before rerunning the analysis.
Inventory validation
Often the accuracy of inventory, as represented by full kanban cards, is significantly higher than the accuracy of balance on-hand. This is because kanban cards are typically updated immediately (a card is reported full when it is filled, empty when material is used out of the associated container), and except for a very small amount of residual inventory from material left in a container even when it has been reported empty, for the most part a card is either full or it’s empty. Getting a count is easy and typically aligned with the number of full kanban cards.
On the other hand, for the balance on-hand, inventory updates can be delayed substantially from the actual usage of the parts—particularly anytime backflushing is used as the primary inventory updating method. This often means a substantial amount of time is required to track down and reconcile the computer balance with the physical quantity on-hand.
The inventory validation report shows differences between the inventory represented by full replenishment cards and the on-hand inventory balance of the supermarket location, flagging any differences greater than some user specified tolerances.
The report compares the two quantities and uses a tolerance percentage specified in Kanban Master Maintenance as well as a lag factor specified in Kanban Master Maintenance. The lag factor allows you to specify the number of kanbans that are typically in process for each loop and unreported. The tolerance factor is used to identify out-of-tolerance situations.
The system applies the lag factor to the on-hand balance before comparing the inventory levels. Inventories that differ by more than the specified tolerance are flagged.
You can use this report to identify situations that might require an audit of card status or an inventory cycle count.
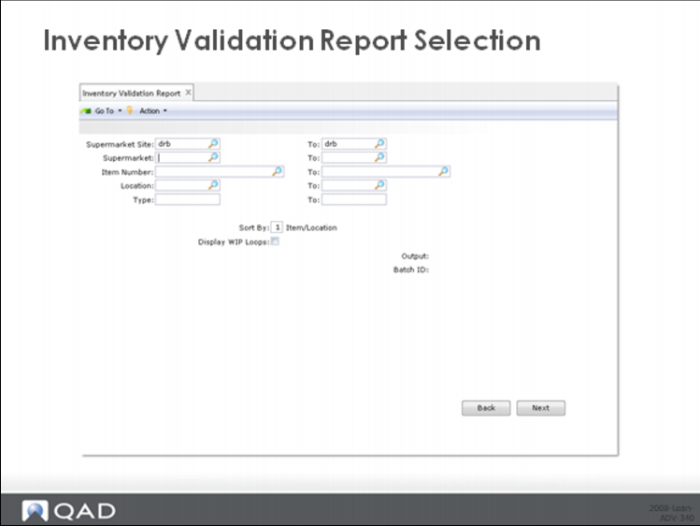
Inventory Validation Report Selection
The user can specify a range of sites, supermarkets, items, locations, and types as a way to select the inventory that should be validated.
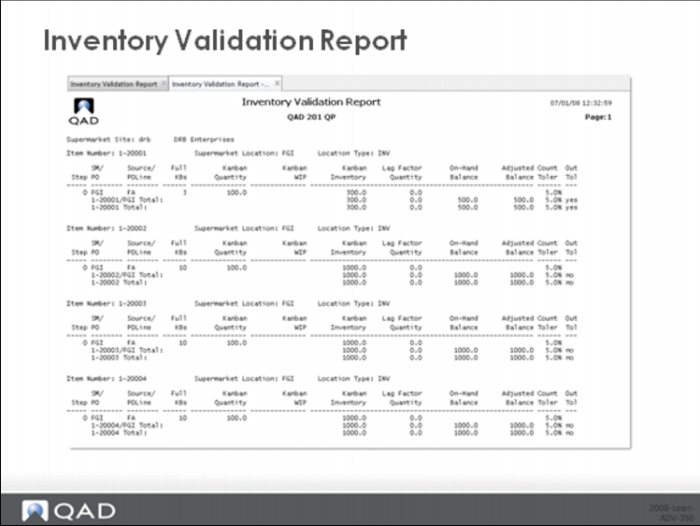
Inventory Validation Report
An example of the inventory validation report is shown above.
You should notice that this method of validating inventory isn’t foolproof and depends on your estimate of the number of kanbans in process. And what might not be immediately obvious, the lag factor needs to be based on the number of kanbans for parent items that are in process and not backflushed, not the number of kanbans circulating for the component in question.
For this reason, the Inventory Validation Report does have a purpose, but in practice it can be more difficult to work with than you might expect.
Missing kanbans (lost cards)
Kanbans are sized to print the exact number of cards that fulfill the demand for the kanban-controlled item. When a kanban card is lost or destroyed, the effect is to cripple the replenishment system, ultimately leading to shortages.
This report determines the time elapsed between the last time a transaction was entered for a specific kanban card and the current date and time. If the amount of elapsed time is greater than the maximum kanban cycle specified for that kanban, then more than likely one of two different things are going to be true:
• The card is missing.
• There is way too much inventory and the card is never being processed.
Without some way of flagging potentially missing cards, the users of the system would be forced to do a period wall to wall inventory.
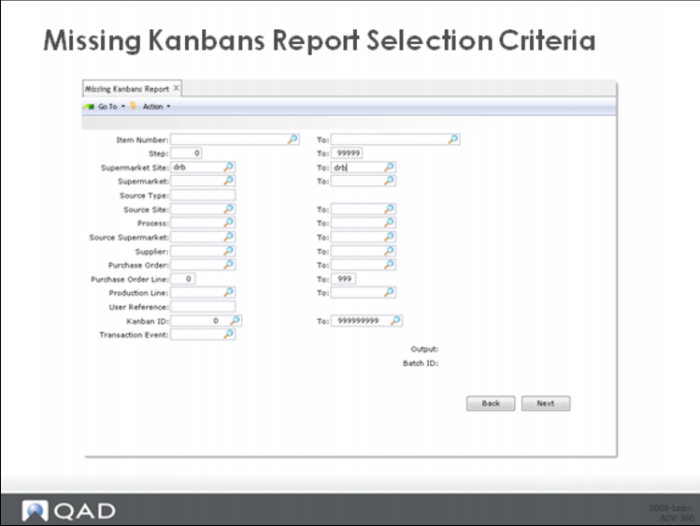
Missing Kanbans Report Selection Criteria
The user can specify a range of items and steps, sites, supermarkets, sources, etc. as a way to tailor the selection to those loops he or she is responsible for.
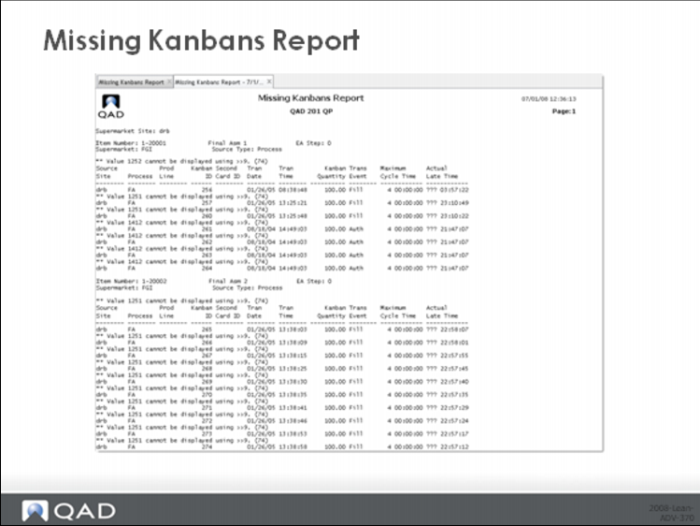
Missing Kanbans Report
An example of the missing kanbans report is shown above.
The Missing Kanbans Report can be used as a kind of exception report to identify and locate kanban card problems without having to do a wall to wall audit.
Wrap Up / Conclusion
That concludes this course on lean manufacturing concepts and the QAD Lean System. At this time you can:
• Review parts of the class that might not have been clear to you.
• Take the on-line comprehension exam that accompanies the session and thus complete the course.
Good luck on your personal lean journey!