Menu Number | Program Name | Description |
7.17.1 | Salesperson Quota Maintenance | Use Salesperson Quota Maintenance to add and maintain monthly sales quotas for salespeople. Totals are given for quota, sales, and cost. |
7.17.2 | Salesperson Quota Inquiry | Use Salesperson Quota Inquiry to generate a screen or printed list of the monthly quotas and quota percentages for a salesperson. |
7.17.3 | Salesperson Margin Inquiry | Use Salesperson Margin Inquiry to generate a screen or printed list of the monthly quotas and gross margins for a salesperson. |
7.17.5 | Sales by Salesperson Browse | Use Sales by Salesperson Browse to generate a screen or printed list of year-to-date sales for a salesperson. The gross margin amounts and percentages are listed. |
7.17.6 | Salesperson Ranking Report | Use Salesperson Ranking Report to produce a report listing salespeople by year-to-date sales. |
7.17.10 | Sales by Site Report | Use Sales by Site Report to generate a screen or printed list of year-to-date sales by site. The gross margin amounts and percentages are listed. |
7.17.13 | Sales by Customer Browse | Use Sales by Customer Browse to generate a screen or printed list of year-to-date sales to a customer. The gross margin amounts and percentages are listed. |
7.17.14 | Sales by Customer Report | Use Sales by Customer Report to produce a detailed report on sales to a customer by product line, quantity, and sales amount. The report sorts by product line within customer ship-to. 12 months of activity appear on the report. Totals are from customer and product line for quantity shipped and sales amount. |
7.17.15 | Customer Ranking Report | Use Customer Ranking Report to produce a report listing customers by year-to-date sales. |
7.17.17 | Sales by Item Browse | Use Sales by Item Browse to generate a screen or printed list of year-to-date sales for an item. The gross margin amounts and percentages are listed. |
7.17.18 | Sales by Item Report | Use Sales by Item Report to produce a detailed report on sales of each item by product line, quantity, and currency amount. The report sorts by product line within customer ship-to. 12 months of activity appear on the report. Totals are from customer and product line. |
7.17.19 | Item Ranking Report | Use Item Ranking Report to produce a report listing items by year-to-date sales. |
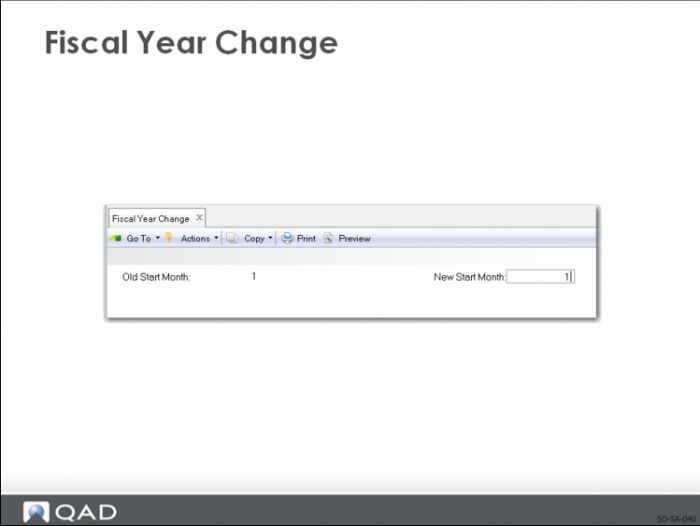
7.17.22 | Fiscal Year Change | Use Fiscal Year Change to change the starting month of the fiscal year. All reporting within the Sales Analysis module is based on a 12-month year. This module reports sales for the calendar year. |
7.17.23 | Sales Analysis Delete/Archive | Use Sales Analysis Delete/Archive to delete/archive sales history for previous fiscal years. |