Report Tree Drill Down
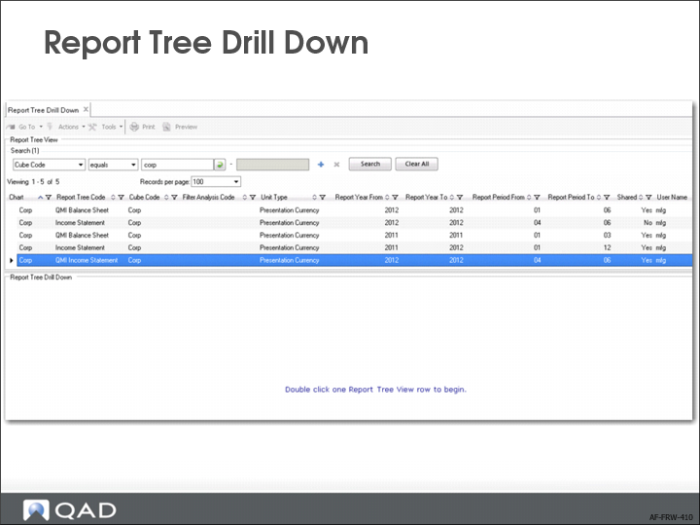
After you create a report tree view, it is available for you to drill into using Report Tree Drill Down (25.16.7.4). Each column in the Report Tree View grid corresponds to a field in Report Tree View Create. In addition to these columns, the first column in the grid—the Chart column—enables you to see the views related to a particular chart of accounts.
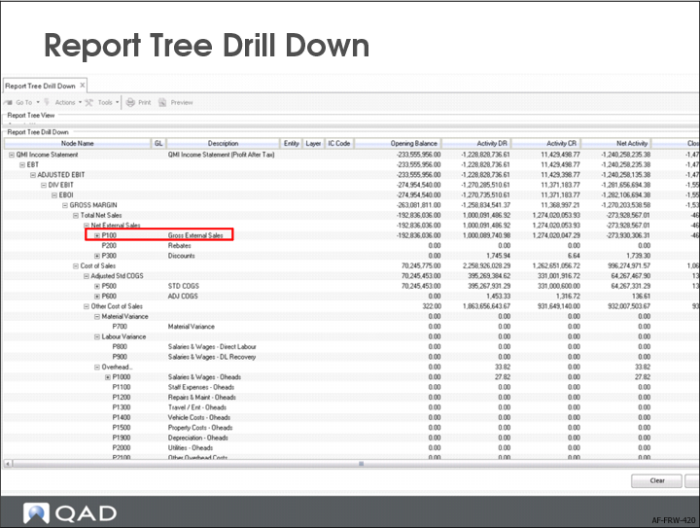
When you double-click the report tree view row you want to view, the tree is displayed in the Report Tree Drill Down area in the same hierarchy as in the financial report. You can then explore elements in the hierarchy step-by-step. By default, the report tree is displayed with all nodes expanded, except for the deepest level.
The columns in the Report Tree Drill Down area give you a consolidated view of the report tree. The columns displayed correspond to the dimensions in the report cube. Therefore, you can see different columns, depending on the report cube that the view is based on. Some dimensions are always available such as entity, layer, and intercompany code.
To make it easier for you to organize the data, you can drag and drop the columns into different positions on the screen. To move a column, click the column header you want to move and drag it to the required position. When you perform this operation, red arrows are displayed to guide you.