DOH Operational Metrics
The Inventory Days On Hand item on the .NET UI Metrics menu supports Days On Hand analysis. It includes two operational metrics:
• Days On Hand By Commodity, which includes aggregated data
• Inventory Days On Hand
Additionally, these two metrics are included on the following QAD-supplied default dashboards:
• Master Scheduler Dashboard
• Production Material Planner Dashboard
• Purchasing Material Planner Dashboard
For information about dashboards, see
QAD Manufacturing User Guide.
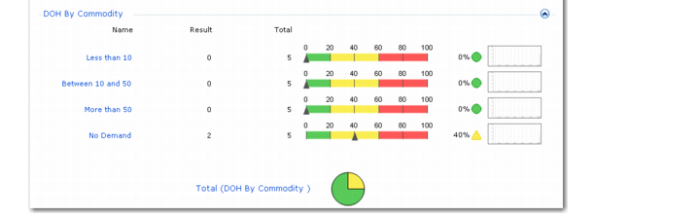
Days On Hand By Commodity Operational Metrics
Use the Days On Hand by Commodity operational metrics to view system-defined aggregated Days On Hand values for all items with the same commodity code.
Important: Run Build Days On Hand Analysis to ensure that the metrics reflect the latest aggregated data.
Available metrics include aggregated Days On Hand By Commodity categorized by total, less than 10, between 10 and 50, and more than 50. Click a category to view the list of commodity codes that fall within that DOH range.
Days On Hand By Commodity Operational Metrics
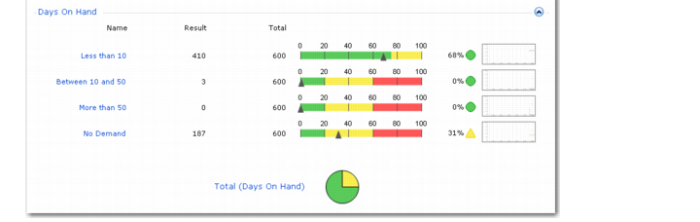
Inventory Days On Hand Operational Metrics
Use the Inventory Days on Hand operational metrics to view days on hand computed for each item in inventory based on current inventory and future demand for an item-site combination.
Available metrics include Inventory Days on Hand categorized by total, less than 10, between 10 and 50, more than 50, and no demand. Click a category to view the list of items that fall within that DOH range.
Inventory Days On Hand Operational Metrics