Working with Supply/Demand Panel Data
When the Schedule Grid displays the scheduled quantity for an item, the Supply/Demand Panel displays the remaining open quantity due for the item. Sources of demand can include forecasts, safety stock requirements, sales orders, customer scheduled orders, component requirements from manufacturing, and so on. Sources of supply include nettable QOH, production orders, production/purchase orders, supplier scheduled orders, and so on.
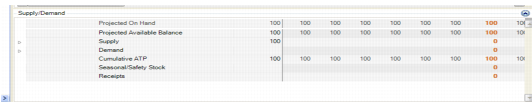
Supply/Demand Panel
When an item is highlighted, the system displays the following associated data in the Supply/Demand Panel:
• POH
The system displays the real-time projected inventory on hand for the item.
The projected on-hand calculation includes firm scheduled quantities from alternate resources for the item. So, for example, if you schedule item A on production lines 1 and 2, and item A has:
• Demand for 100 outstanding
• A production order for 50 on production line 1
• A production order for 100 on production line 2
Then, the system displays a POH of 50 for production line 1.
The repetitive projected QOH calculation is as follows:
WO Open quantity + Nettable Inv – Total demand
Where:
Nettable Inv = From MRP Detail (23.16)
Total Demand = Independent + dependent + forecast + seasonal
WO Open quantity = SNRD
The POH status for both repetitive and production orders derives from the POH calculation. If any POH for that item is below safety stock, POH status is set to safety stock status. If any POH is < 0, the POH status is set to below-zero status.
Additionally, the repetitive and production order PAC status derives from the POH calculation. If any POH for that item is below safety stock, POH status is set to safety stock status. If any POH is < 0, the POH status is set to below-zero status.
Past Due (Demand)
The system displays past-due totals by demand type.
Note: This includes all past-due demand for the item—not just demand from the specified historical period.
Record Type
The following are examples of the types of records that display:
• Independent demand
The system displays independent demand from QAD EE for the selected item.
This quantity includes confirmed sales orders, DRP orders, and type 3 (required ship schedule) customer schedules.
All demand values match quantities shown in MRP Detail Inquiry (23.16).
• Dependent demand
The system displays additional demand from QAD EE based on dependent demand from parent-level items for the selected item.
• Forecast demand
The system displays the net balance of current forecast demand from QAD EE for the selected item.
QAD EE stores forecasts by week. The workbench shows the entire forecast for the week on one day.
The system displays the net balance of current forecast demand from QAD EE for the selected item. Master production scheduling and MRP use the net forecast and abnormal sales order demand to calculate total demand. The net forecast is calculated as follows:
Net Forecast = Forecast – Sales Order Demand
When the shipment forecast is oversold—that is, the quantity sold exceeds the forecast amount—the net forecast will not go below zero.
• Seasonal/safety stock
The system displays seasonal build quantities as well as safety stock.
The system performs the following calculation for each date when a master scheduled receipt is due or a seasonal build quantity is made available, causing a net increase in supply. It takes into account all sales order and required ship schedule demand and gross requirements up to the next increase in available supply.
Master Scheduled Receipt – Sales Orders and Required Ship Schedules – Gross Item Requirements – Seasonal Build Net Increases + Seasonal Build Net Decreases = ATP
• Receipts
The system displays supply from order receipts, such as production order receipts.
• Production Forecast
When you establish planning bills and forecast and master schedule at the family-item level, the system automatically calculates the derived demand for components of the family or upper-level item. These calculations are based on the ATP quantities for the family-level item and the quantity per and forecast percentage for the components of that family item. The result is called a production forecast, since it derives from the master production schedule and the forecast percentage specified in the planning bill.
• Planned Scrap
The number of items planned as unusable while producing the quantity.
Scrapped quantity displays on work order history and cost reports. The total GL cost of the rejected items posts to the scrap account.