QAD Reporting Framework Architecture
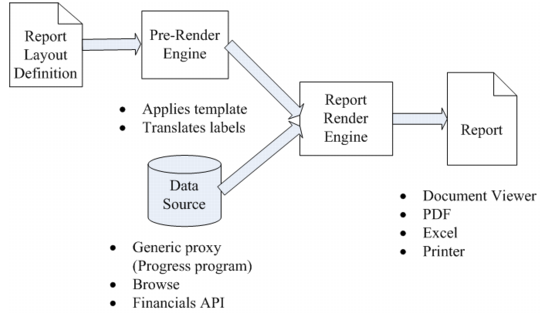
The QAD Reporting Framework contains five key components: report render engine, report layout definition, data source, pre-render engine, and report. The following diagram illustrates the QAD Reporting Framework architecture at a high level.
QAD Reporting Framework Architecture
• Data source
Data to be displayed on the report are queried from the underlying business system through the data source definition. The QAD Reporting Framework supports three types of data sources: generic proxy (Progress program), browse, and Financials API. For detailed information on the three types of data sources, see
Choosing a Report Data Source.
• Report layout definition
Report layout definition defines what gets displayed on the report, and where. You use Report Designer in the QAD .NET UI to define the report layout in WYSIWYG (What You See Is What You Get) fashion. You can also import and export report layout definitions as XML files, which makes it very easy for you to deploy reports or migrate them between systems, such as moving reports from the test environment to the production environment.
• Pre-render engine
The pre-render engine pre-processes the report layout definition by applying a report template to it as well as performing label translations and produces a modified report layout definition. The resultant report layout definition along with the data source are then fed into the report render engine, which generates the actual report.
• Report render engine
As the core of the solution, the report render engine takes in data set and report layout definition as inputs, then renders and produces the report output. Since the QAD Reporting Framework is a .NET solution, the report render engine can only run on the Windows operating system.
The rendering process takes place on the computer that actually runs the report. If you run a report in the QAD .NET UI on your PC, then your PC’s CPU power is consumed to render the report, which helps to distribute the processing load across client machines.
• Report
The report output can be rendered in three different formats, depending on your preference. The default format is a document displayed on the screen, which you can view by paging and zooming. You can then send it to printer if you want a hard copy. Alternately, the report can be exported into the PDF or Excel format, which you can print or save as a file.