Working with Report Sections
About Report Sections
A basic report is divided into five sections: header, page header, details, page footer, and footer. The sections contain fields that hold the labels, variables, and expressions that you want in the printed report. If you add groups to a report, the report will also contain a group header and a group footer section. For example, a report with 3 grouping levels will have 11 sections.
The sections of the report determine what each page, group, and the beginning and end of the report look like. The following table describes where each section appears in the report and what it is typically used for.
Report Sections
|
Section
|
Appears
|
Typically Contains
|
|
Report Header
|
Once per report
|
The report title and summary information for the whole report.
|
|
Page Header
|
Once per page
|
Labels that describe detail fields, and/or page numbers.
|
|
Group Header
|
Once per group
|
Fields that identify the current group, and possibly aggregate values for the group; for example, total, percentage of the grand total.
|
|
Detail
|
Once per record
|
Fields containing data from the source record set.
|
|
Group Footer
|
Once per group
|
Aggregates values for the group.
|
|
Page Footer
|
Once per page
|
Page number, page count, date printed, report name.
|
|
Report Footer
|
Once per report
|
Summary information for the whole report.
|
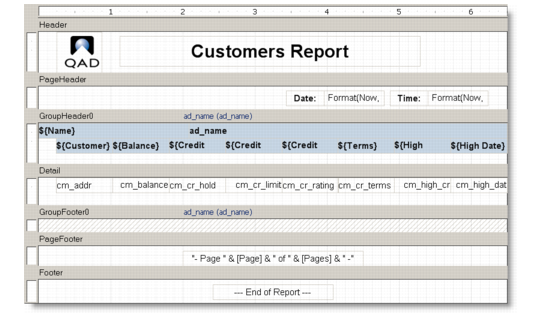
In this example, the Header section contains a label with the report title. The Page Header section contains labels that display the current date and time. The Group Header section contains labels that identify the fields in the Detail section, and the Page Footer section contains fields that show the page number and the total page count for the report. Data is grouped inside a group section marked by a group header and a group footer.
Report Sections Example
Note that sections can be made invisible, but they cannot be added or removed, except by adding or removing groups.
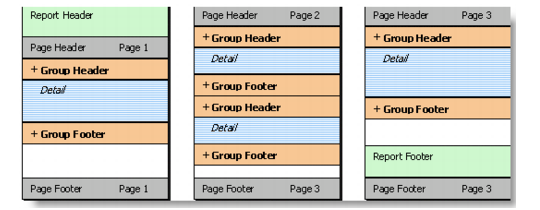
The following diagram shows how each section is rendered on a typical report.
Rendering a Report
• Report Header
The first section rendered is the Report Header. This section usually contains information that identifies the report.
• Page Header
After the Report Header comes the Page Header. If the report has no groups, this section usually contains labels that describe the fields in the Detail Section.
• Group Headers and Group Footers
The next sections are the Group Headers, Detail, and Group Footers. These are the sections that contain the actual report data. Group Headers and Footers often contain aggregate functions such as group totals, percentages, maximum and minimum values, and so on. Group Headers and Footers are inserted whenever the value of the expression specified by the GroupBy property changes from one record to the next.
• Detail
The Detail section contains data for each record. It is possible to hide this section by setting its Visible property to False, and display only Group Headers and Footers. This is a good way to create summary reports.
• Page Footer
At the bottom of each page is the Page Footer Section. This section usually contains information such as the page number, total number of pages in the report, and/or the date the report was printed.
• Report Footer
Finally, the Report Footer section is printed before the last page footer. This section is often used to display summary information about the entire report.
• Customized sections
You can determine whether a section is visible by setting its Visible property to True or False. Group Headers can be repeated at the top of every page (whether or not it is the beginning of a group) by setting their Repeat property to True. Page Headers and Footers can be removed from pages that contain the Report Header and Footer sections by setting the PageHeader and PageFooter properties on the Layout object.
Resizing a Report Section
To resize a section, select its border and with your mouse pointer drag to the position where you want it. The rulers on the left and on top of the design window show the size of each section (excluding the page margins). Note that you cannot make the section smaller than the height and width required to contain the fields in it. To reduce the size of a section beyond that, move or resize the fields in it first, then resize the Section.
To see how this works, move the mouse to the area between the bottom of the Page Header section and the gray bar on top of the Detail Section. The mouse cursor changes to show that you are over the resizing area. Click the mouse and drag the line down until the section is about twice its original height.
Resizing a Report Section
Release the mouse button and the section is resized.
Hiding a Report Section
You can hide a report section so that it will not appear in the printed report. However, a hidden section is still visible in the design view.
To hide a report section, click a section to select it; then set its Visible property to False in the Properties box.