QAD 2017 Enterprise Edition
>
User Guides
>
Reporting Framework
>
Running Reports
>
Running Reports
Running Reports
After a report is designed, you can set filter criteria to filter data in the report, run the report, and send it to different output destinations.
To run a report
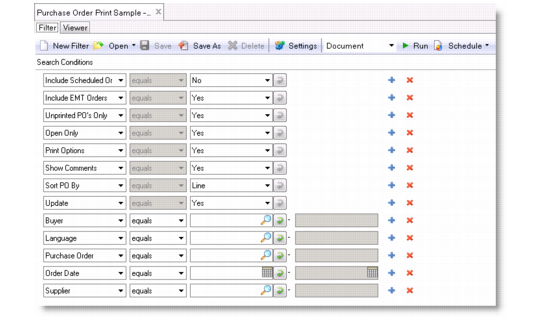
1 Double-click the report menu item in the Applications menu tree or right-click it and choose Open from the shortcut menu. The Report Filter screen is displayed in the application area.
Report Filter
2 By default, a report will display all the records available in the source data. However, you may want to retrieve just a certain range of records in the report; for example, sales records between last September and this March. You do this by setting search conditions to filter data in the report. You can also use filters to load existing search conditions. For information about using filters, see
Using Report Filters.
Note: The default report filter parameters are predefined in the data source proxy program and you can only change them by modifying the program code.
The query constructor provides extensive, configurable filter capabilities that let you create both simple and complex queries. Choose a search operator from the drop-down list.
a The search operators include the following:
• equals
• not equals
• contains
• range
• starts at (the default)
• greater than
• less than
• is null
• is not null
b If you choose the Range operator, enter a beginning value of the range in the first search box. Optionally, enter an ending value of the range in the second search box.
c To refine your search further, click the plus (+) icon to add another search row. You can add as many rows as needed, each with different search values and operators. When you specify several criteria, note that multiple criteria for the same field are treated as a logical AND condition.
d To remove a search criteria row, click on the delete (X) icon.
e Optionally, save the new search conditions as a filter for future reuse. For information about working with filters, see
Using Report Filters.
3 On the toolbar, select a layout from the Layout pull-down list. (Available for a report resource with multiple report definitions.) The default layout is listed in bold text.
4 On the toolbar, select an output format from the pull-down list before the Run button. You can choose from three output formats when the report is run:
• Document — The report is displayed in the Report Viewer window.
• PDF — The report is rendered as a PDF file. You can save the file and open it in the Report Viewer window.
• PDF Read-only — The report is rendered as a read-only PDF file. It has a random password that prevents tampering with the document.
• TIFF — The report is rendered as a Tagged Image File Format (TIFF) file.
• RTF — The report is rendered as a Rich Text Format (RTF) file.
• Excel — The report is rendered as a Microsoft Excel (.xls) file. You can save the file and open it in the Report Viewer window.
• Plain Text — The report is rendered as a plain text (.txt) file.
The Document and PDF formats offer the highest display quality. Some images and colors may appear differently in some render types (for example, TIFF and RTF), and may not appear at all in others (for example, Plain Text).
5 Press the Enter key or click Run. A report generation progress bar appears. When report generation is complete, the report is displayed in the Report Viewer window directly or opened as a PDF or Excel file depending on which output format you selected.