QXtend Outbound Dashboard
The following material covers the QXtend Outbound (QXO) dashboard. IntroductionExplains how to use the Dashboard. Viewing Services SummariesDiscusses different service statuses. Viewing Specific ServicesExplains how to view different services with the Event Services Dashboard. Monitoring Source ApplicationsExplains how to use the Overview node. Dashboard ServiceIntroduces the QXO Dashboard Service.Introduction
The Dashboard displays by default with a system overview. There are two basic views—Overview and Services—displayed in the navigation tree. Click Overview to view the output from your defined source applications and subscribers. Click Services to view details for event services, message publishers, message senders, email service, archive service, and dashboard service.
Outbound Services Dashboard
Note: The input date format on the dashboard UI is American and is not configurable. Database date formats can be either dmy or mdy, but both the qxevents and the qxodb databases must have the same format. Note also that time data being returned from the database, such as Date-Time fields on the Logs screen or modification time fields on the profiles, are in the format of the qxodb database.
Use the navigation tree on the left to drill down to further details. The charts that display for each source application, service, and subscriber view use a standard timeline format showing the previous hour of activity broken into ten six-minute periods. Adjust the view by resetting the start and finish times in the individual views. The minimum total period is 10 minutes.Note: The archive service, email service, and dashboard service display service status information as a table, not a chart.
Click the Download icon in the title bar of a chart to view the data represented in the chart in an HTML table. You can then save this data for import to a spreadsheet application such as Excel and create your own graphs.
Download Icon
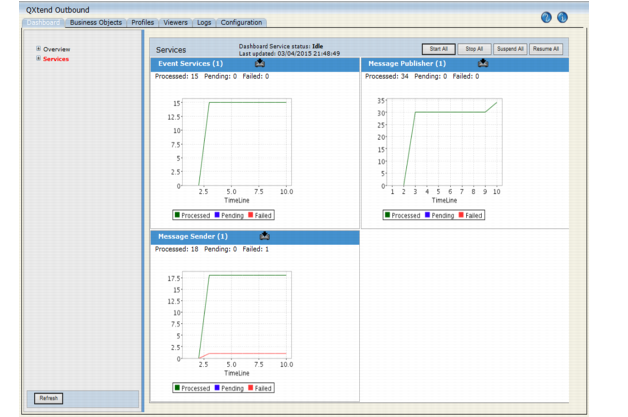
Note the numbers at the top of each chart in Figure 5.1. One event service, one message publisher, and one message sender are running. The event service processed 15 events.