How QAD reduces implementation time and cost
Transportation Management Dashboards
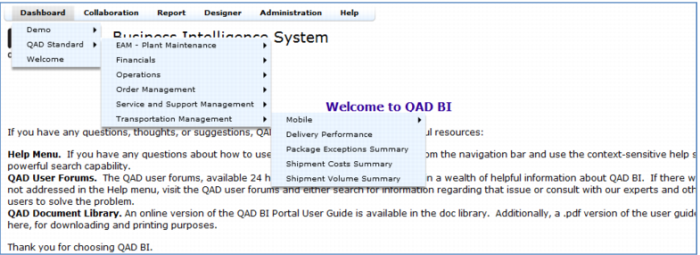
You do not have to set up all of the Business Intelligence Metrics for Transportation Management from scratch. QAD provides four standard dashboards:
• Delivery Performance: displays common measures of carrier performance, helping you identify potential issues and discover opportunities for improved delivery performance and customer service.
• Package Exceptions Summary: summarizes delivery exceptions and delays, providing information you need for customer reviews and carrier contract negotiations.
• Shipment Costs Summary: analyzes transportation spending including freight and other charges, helping you identify potential savings and providing data for negotiating more favorable carrier rates.
• Shipment Volume Summary: monitors shipment volumes, weights, origins and destinations, helping you identify trends and evaluate shipping habits.
Each of these dashboards includes a number of graphs, charts and reports that present consolidated transportation information and key performance indicators, providing comparative results and visualizing trends graphically.
Demo
1. Select Dashboard > QAD Standard > Transportation Management
Key Points
• Multiple dashboards; shipments and shipment tracking data
• Graphs, charts and reports
• Comparative results