How QAD supports root cause analysis
Drill-Down
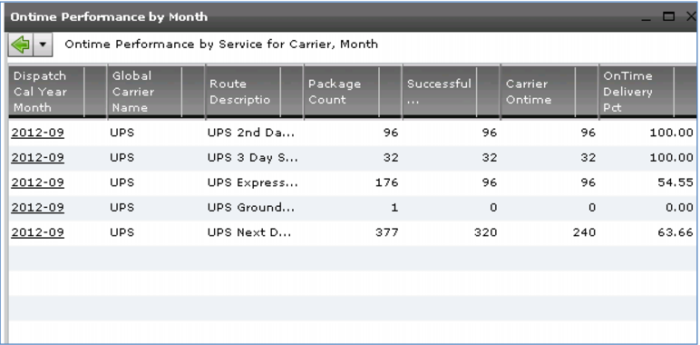
Graphs give you a high-level view. To get more details, click any node – for example last month’s on-time performance for Carrier UPS. In this case, you see the on-time performance for each service or route – 2nd or 3rd day delivery, UPS Express, Ground or Next Day.
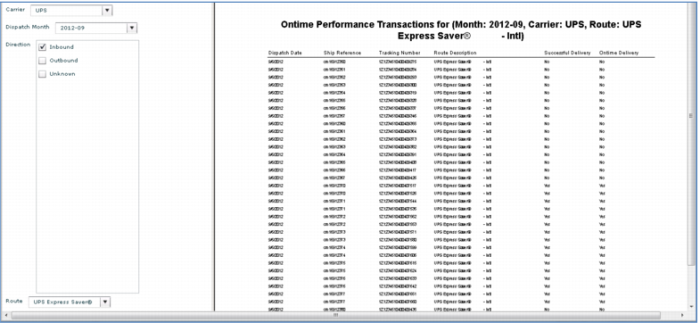
For more, click any line – in this case accessing a detailed report of express shipments. Every shipment reference and tracking number is included so you can easily look up the details in the source system. Export this to a pdf or spreadsheet for further analysis.
Demo
1. In On time Performance by Month, click UPS Node 2012/09
2. Click 2012-09 UPS Express
3. (Optionally) Page-down, click Export to Excel

icon
Key Points
• Drill down for detailed analysis
• Graph to grid to report
• Export to pdf or Excel
• Shipment reference from the source system
• Tracking number from the shipment tracking system
o one or more per shipment