QAD Customer Relationship Management
>
CRM Overview Demo Guide
>
Demonstration Summary
>
How QAD supports fact-based decisions
How QAD supports fact-based decisions
Dashboard
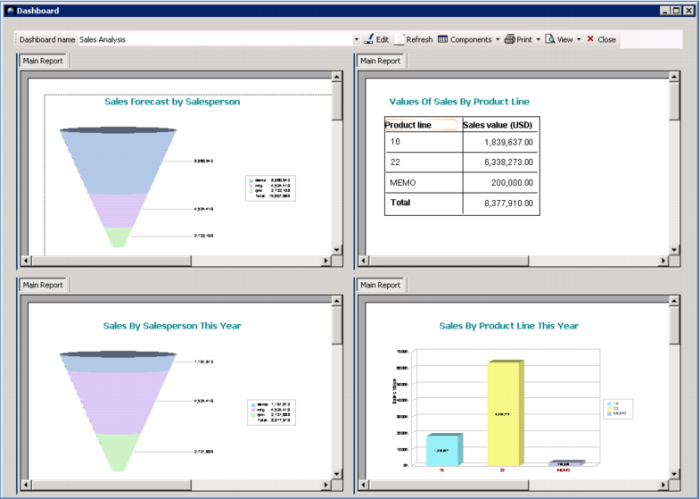
You will have clear visibility into sales performance with reports and visuals like you see here – bar charts, graphs, pie charts – giving you an “at a glance” view of where you stand; what deals are in the pipeline; what are your top opportunities; where are your reps spending their time.
Each manager can have his/her own dashboard, customized to give a real-time view on key events and activities they need to know about – enabling proactive resolution and opportunity management.
Demo
Key Points
• Real-time view of data
• Bar Charts, Graphs, Pie Charts
• Multiple Dashboards, customize by area or manager