Reports and Dashboards
This chapter provides information of Reports and Dashboards, which help generate the information you need for making strategic decisions.
Overview
In this chapter, you learn how QAD CRM helps you generate the information you need for making strategic decisions by reporting and analyzing your customer relationships and business opportunities.
Learning Objectives
By the end of this chapter, you are able to do the following
• List the reporting tools available in QAD CRM.
• Explain Report Categories.
• Create, run, and save Browser Reports.
• List the available Standard Reports.
• Run and filter Standard Reports.
• Create charts and graphs.
• Describe a Dashboard.
Reporting Functionality
QAD CRM users can report on their data using the following:
• Browser Reports
• Delivered Standard Reports
• Export data to defined output channels
Reports screen
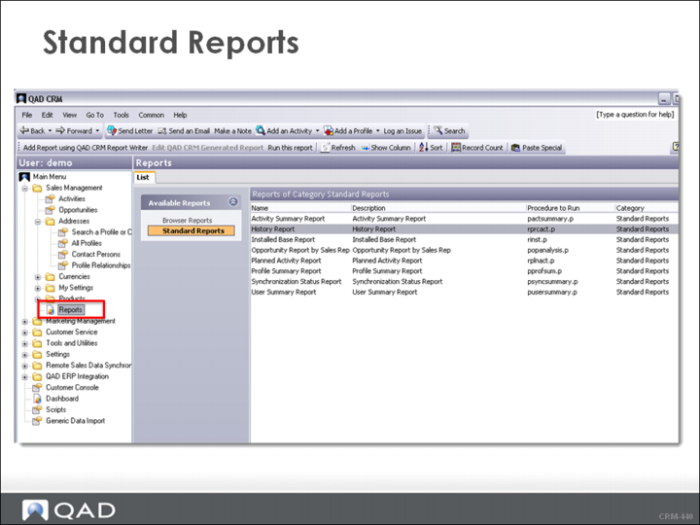
The Reports screen displays the saved reports available for your reuse in QAD CRM.
You also create reports using the Report Writer tool from the Reports screen.
The Reports screen is available from both Sales Management and Marketing Management. The Sales Management navigation path is:
Main Menu|Sales Management|Reports
Report Categories
Report Categories allow you to categorize your reports for quick access. There are system pre-delivered report categories on the Reports scree. Your System Administrator can also define the report categories.
The training system has two Report Categories defined - Browser Reports and Standard Reports. Other common categories include Dashboard Reports, External Reports, or subject categories such as Customer or Profile Reports.
Browser Reports
A browser report provides a report layout of the records displayed in a browser. You can create browser reports in the system through any of the data screens, such as Profile browser, Contact browser, and Opportunity browser.
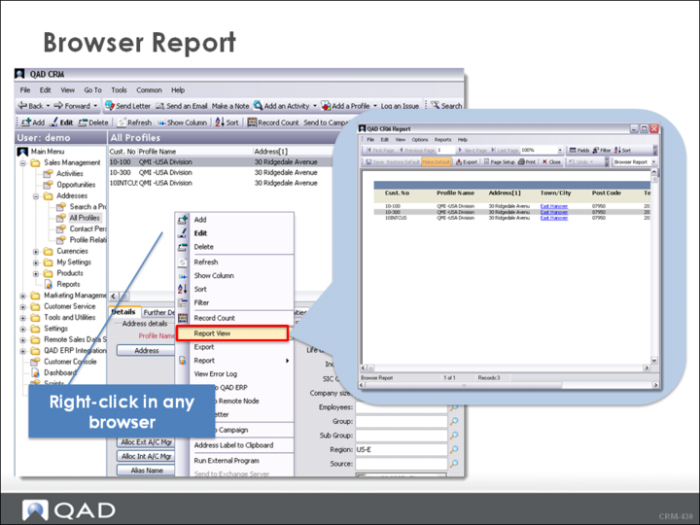
To access default browser reports, right-click any data screen and choose Report View. The browser report displays in the report viewer. You can also format the contents into a more sophisticated report.
You can modify the settings of the report through the toolbar buttons, then save new instances of a displayed browser report.
Formatting a Browser Report
• A browser report is displayed according to the data in the browser window. You can use the Show Column feature to rearrange or omit columns from the browser and your report output.
• Once the data is in the Report View, you can use the Report View formatting toolbar to format the report:
Saving a Browser Report
Browser Reports can be saved and rerun. When you save a Browser Report on the Test System, save the Report to the Browser Category.
Note: Modify the generated browser report before you save it. Otherwise, the Save button is inactive.
Running a Saved Browser Report
To run a saved browser report:
1 Go to the browser where the saved browser report is generated.
For example, if you want to run a browser report that is created in the Contact Persons browser, ensure that you are in the Contact Persons browser.
2 Right-click in the browser and choose Report View from the context menu.
A browser report is generated.
3 On the toolbar of the new report window, click Browser Report to open the list and choose the report that you want to run.
4 If the content of the report is not up-to-date, click Refresh button to update it.
Standard Reports
QAD CRM delivers the following eight (8) Standard Reports to help you manage your organization. The names of these reports indicate the nature and scope of the data extract. Standard Reports display using Crystal Reports and Microsoft Excel depending on the report.
• Activity Summary Report
• History Report
• Installed Base Report
• Opportunity Report by Sales Rep
• Planned Activity Report
• Profile Summary Report
• Synchronization Status Report
• User Summary Report.
Running Standard Reports
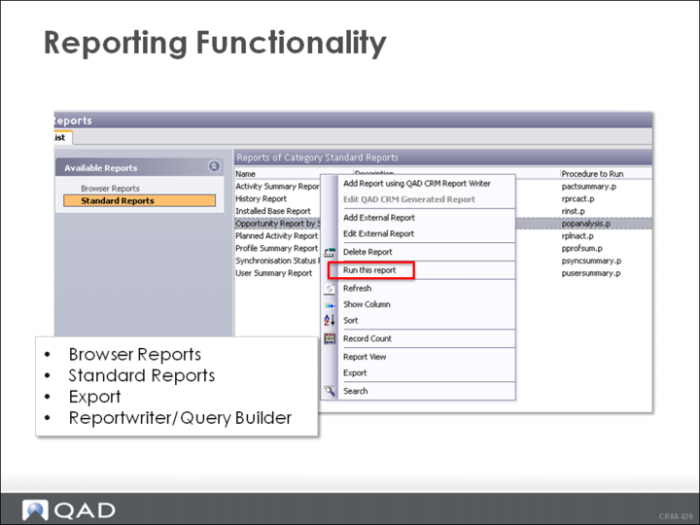
You can run Standard Reports directly from the Reports screen. There are a number of ways to run a report from the Report Screen. Select the report and do one of the following:
• Click Run this report on the toolbar.
• Right-click and choose Run this report.
• Click File|Run this report.
Filtering Standard Report Output
QAD CRM allows you to filter the output from Standard Reports depending on the report. The following reports allow you to define filter criteria from the Report Viewer by clicking the Filter button:
• Activity Summary Report
• History Report
• Planned Activity Report
• Synchronization Status Report
• User Summary Report.
The following reports when run from the Reports screen display a filter window where you define the selection criteria before the report runs:
• Profile Summary Report
• Opportunity Report by Sales Rep
• Installed Base Report.
Note: When QAD CRM is integrated with QAD ERP, the Profile Summary Report uses data from both applications and the filter settings display an additional filter called QAD ERP options.
Exporting Reports
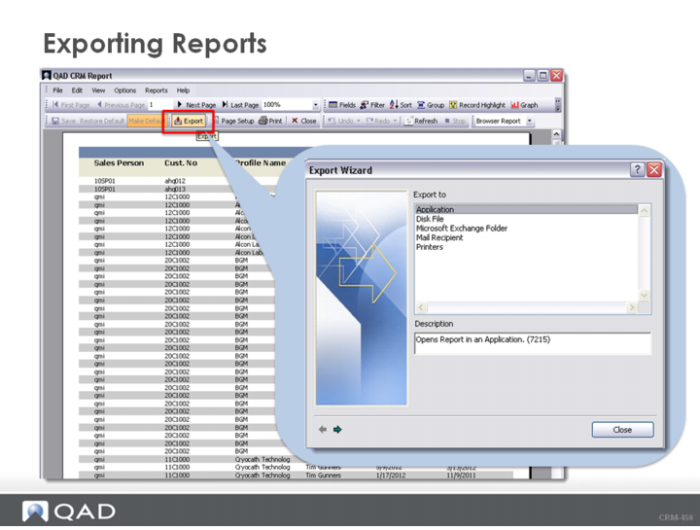
The system allows you to choose the output channel of a selected report through the Export option. There are multiple ways to export a report:
• Choose Export from the File menu.
• Right-click in the browser and choose Export from the context menu.
• Click Export on the toolbar from the report display.
The Export Wizard prompts you to choose one of the following output channels:
• Application
• Disk File
• Microsoft Exchange Folder
• Mail Recipient
• Printers
You can export your data to the following applications from the VTMS (Training) Environment:
• Acrobat Format (.pdf)
• Crystal Reports
• Internet Explorer - HTML or XML
• Microsoft Excel
• Microsoft Word - Document or Rich Text
• WordPad
• Notepad
In this class, we take MS Excel format as an example. To export a report to MS Excel:
1 Form the toolbar of a report, click Export.
The Export Wizard is displayed.
2 Select Application in the Export to area and click the forward navigation arrow on the bottom-left corner of the wizard.
3 On the Export to Application page, select Microsoft Excel (.xls) and click OK.
4 When the exported report opens in MS Excel, save the .xls file to your desired directory.
If you do not want to preview the report or changing settings for the report before exporting, you can do the following to export:
• For Browser Report, right-click in the browser where you want to generate a report and choose Export from the context menu.
• For Standard Report, right-click a report at Sales Management|Reports|Standard Report and choose Export from the context menu.
Dashboard Functionality
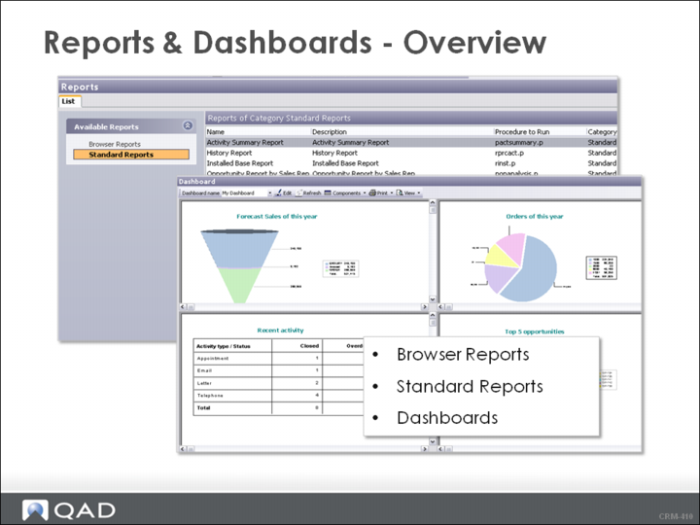
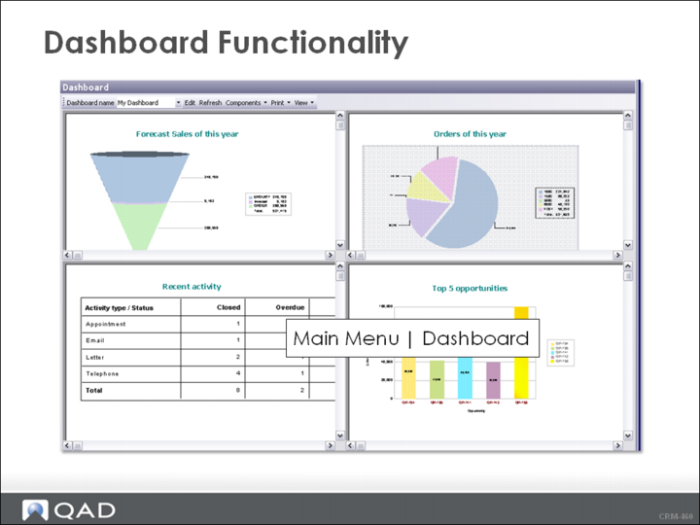
• The Dashboard is a user-defined screen that provides an overall view of your CRM environment.
• The Dashboard screen can be composed of a maximum of four separate views or components.
• Typically a Dashboard is created and maintained by a System Administrator or power user or reporting specialist.
Navigate to Main Menu|Dashboard and choose My Dashboard from the Dashboard Name. Review the information displayed in the dashboard.
How to maintain and create Dashboards is covered in the CRM User Guide and in the System Administrator Training.
Master Questions
1 Report Categories are used as file drawers or containers to help us organize and access our saved reports quickly. (True or False?)
2 When you save a browser report, you can access the report from any record browser in QAD CRM. (True or False)?
3 In the Browser View Report, you can remove fields, change fonts, sort and group data, and create _________________.
4 Name the Standard Report that uses both QAD CRM data and QAD ERP data if integration is active. ______________________________.
5 Name three (3) applications that you can export your data to for reporting:
f _____________________________
g _____________________________
h _____________________________
6 Dashboards can contain a max of _________ components.
Wrap-Up
• QAD CRM has a number of reporting tools and options including:
• Browser Reports
• Delivered Standard Reports
• Exporting data to various output channels (including Microsoft Excel and Word)
• Browser Reports are created and launched from record browsers.
• Saved Browser Reports can be accessed from View Report.
• Standard Reports are predefined and use Crystal Reports or Microsoft Excel to display output.
• Dashboards are typically created by System Administrators.
• Dashboards can contain up to four components (charts, graphs) and give users a view of their CRM business - opportunities, forecast, activities, etc.
• Standard Reports use two types of filters, one filter is part of the report viewer and the other filter must be defined before your run the report.
Exercise
Task 1. Create a report using a 3-D pie chart that breaks down the number of Customer Profiles by Country.
1 Navigate to the All Profiles Screen, set filter to No Filter, and right-click to select the Report View.
2 The Report View contains a list of All Profiles including Suppliers, Customer, and End Users. You are only interested in Customers.
3 In the Report View, select Filter from the Toolbar. Choose Simple Filter. Enter the following values in the Customer Filter:
• Field = Profile Type
• Condition = Contains
• Value = customer
Click OK to apply the Filter to the report.
4 Choose Graph from the Toolbar to launch the Graph Designer. Select Pie and click the 3-D Icon for a 3-D Pie Chart.
5 Select the Data Tab and add the Country field to both the On change of box and the Show Value(s) box.
6 Select the Format Tab and enter a Title for the Pie Chart.
7 Click OK and save the Browser Report as:
• Name = Customer Profile Analysis
• Description = Customer Country Profile Analysis
8 Navigate to the Reports screen and select the Browser Report category.
Note: If the Customer Profile Analysis report does not display, fresh the screen (File|Refresh).
Task 2. Run a Profile Summary Report for one of your customers.
Once a quarter, you run a Profile Summary Report for each of your customers. This report gives you a 360-degree view of all activities for the Profile. Today you want to run a Profile Summary Report for Houston Automotive Group.
1 In the Standard Reports category of the Reports screen, right-click the Profile Summary Report and click Run this report.
The Profile Summary Report screen displays.
2 Right-click in the profile browser area and choose Attach Profile from the context menu.
The Find Profile/Contact screen displays.
3 Search for the profile of Houston Automotive Group.
4 After add the profile to the report, review the Basic Filter selection criteria on the bottom part of the Profile Summary Report screen. Clear the following filter options and click OK.
• User-Defined Fields
• Addresses
• Campaigns
• Contracts
• Installed Base
• Contract
5 You are prompted to Save the Report Settings so you can rerun the report later. Save the report.
6 Review the report in the Crystal Report Browser. You can hyper-link to each section of the report from the left-hand column, print the report, or save the report results.
7 The Profile Summary Report of Houston Automotive Group appears in the Reports screen|Standard Reports category for later access.