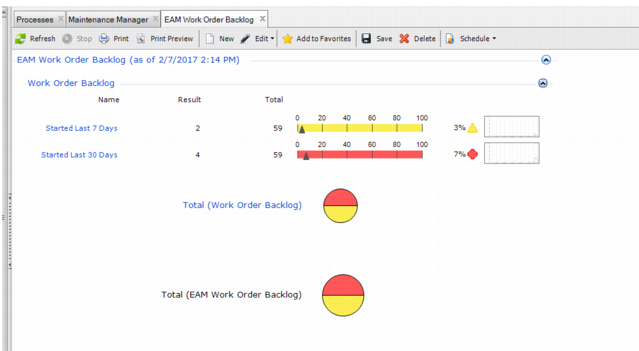
EAM Work Order Backlog
The EAM Work Order Backlog metric illustrates how many work orders that were started in the past 7 days and past 30 days remain open in the system.
EAM Work Order Backlog
The Result and Total columns list the raw data values of WOs that have been opened during the respective time periods and the system-wide total number of open WOs. That data is used to determine the percentage of WOs that remain open. The percentage is displayed to the right of the colored line graphs. The triangle along the yellow line marks the percentage of work orders that were started in the past seven days and remain open. The triangle along the red line marks the percentage of work orders that were started in the past 30 days and remain open.
You can drill into the data by using the Break By option in the right-click menu.
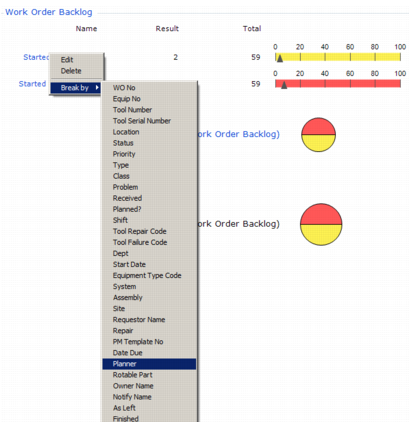
EAM Work Order Backlog Break By
For example, you can generate a new graphic that displays open WOs by Planner for the WOs that were started in the past seven days, as shown in
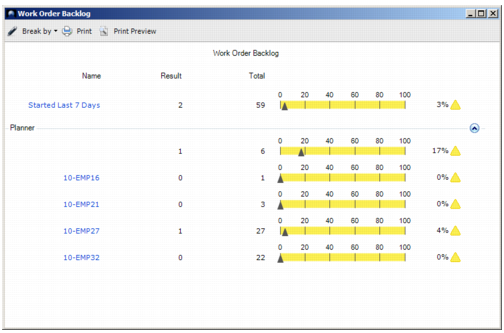
EAM Work Order Backlog Break By Planner.
EAM Work Order Backlog Break By Planner
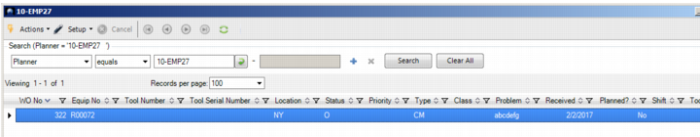
You can continue to drill into the data by selecting one of the planners in the left column to view the details about the specific WO that is still open.
EAM Work Order Backlog Break By Planner Browse