Service Requests
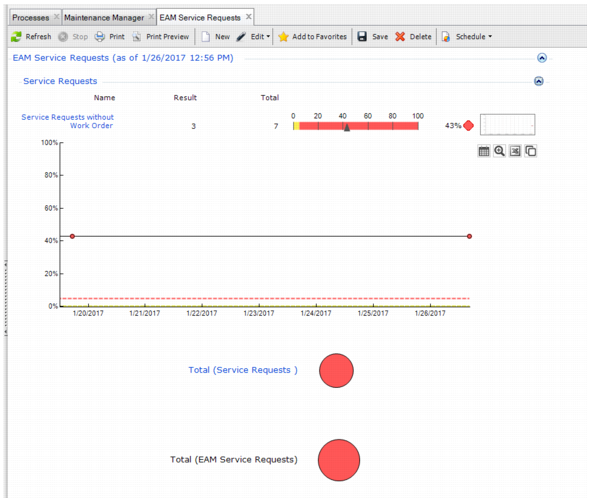
You want to ensure service requests entered into your system are being turned into WOs. The Service Request metric answers that question quickly with its color graph.
The Result and Total columns list the raw data values of service requests without WOs and total service requests. That data is used to determine the percentage of service requests that have not been turned into WOs. The percentage is displayed to the right of the colored line graph. The yellow on the graph’s line is set at five percent, which is considered a tolerable number of service requests to have not been turned into WOs.
cl
Service Requests
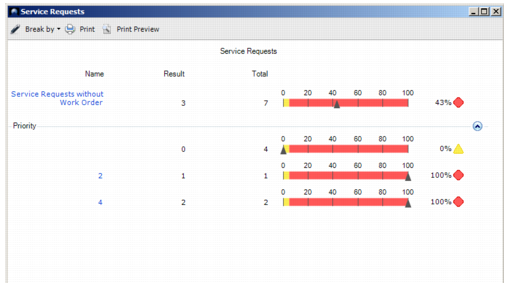
You can drill into the data by using the Break By option in the right-click menu.
Service Requests without Work Orders Break By Priority shows the service requests without work orders by priority.
Service Requests without Work Orders Break By Priority
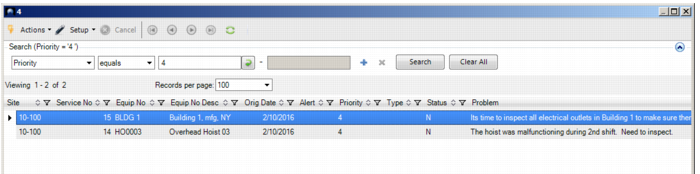
You can continue to drill into the data by selecting a priority in the left column to view the details about the specific service requests that have not been turned into WOs.
Service Requests without Work Orders