Report Column Group Maintenance
The Financial Report Writer produces reports that can have up to 99 columns in the setup and report generation logic. However, the standard layout of the printed output has up to 16 columns predefined. If you want to create a report with more than 16 columns, you need to add the required additional columns with the Report Resource Designer tool. You can define the number of columns, the content of each column, and the presentation details in Report Column Group Maintenance.
When you create a column group, you can use it as part of the report master record that you create using Report Master Maintenance. You can create as many column groups as you need. Each column group is also linked to a report chart because you can specify a report analysis code as the detailed element of a column and report analysis codes belong to a report chart.
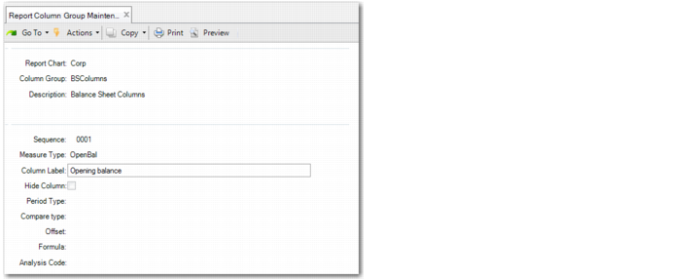
When you start Report Column Group Maintenance from the menu, the following screen opens:
Chart
Enter a report chart code. The code must reference an existing report chart.
Column Group
If you are creating a new column group, the center of the screen remains blank and you can start to enter the column details at the end of the screen. If you enter an existing column group, the center of the screen displays an overview of the column details. You cannot modify columns in the center of the screen. However, you can modify the details of an existing column at the end of the screen if you enter the corresponding column sequence number. You can also add new columns to the end of the screen by entering a new sequence number one higher than the highest existing sequence number of the column group. For example, if the column group already has three columns and you want to add a new column, in the Sequence Number field, enter 4.
Description
Enter a description of the column group. You can enter a maximum of 30 characters.
Sequence
This field contains the Column Sequence Number. You can specify up to 9999 columns.
Measure Type
Specify the type of balance that you want to display in this column. You can choose from OpenBal, OpenBalDR, OpenBalCR, OpenBalQTY, Activity, ActivityDR, ActivityCR, ActivityQTY, CloseBal, CloseBalDR, CloseBalCR, CloseBalQTY, Calculated.
• The OpenBal types provide the opening balance at the beginning of the reported period (From Year and From Period).
• The CloseBal types provide the closing balance at the end of the reported period (To Year and To Period).
• The Activity types provide the activity during the complete reported period (From Year/Period - To Year/Period).
• The types ending with QTY provide the quantities posted on the GL account for accounts defined with quantity analysis. The other measure types provide amounts in the presentation currency defined in the report cube.
Column Label
Specify the label to print above the column on the report. You can enter plain text and use special variables as part of the text. The special variables are:
• FY#: From Year
• FP#: From Period
• TY#: To Year
• TP#: To Period
• FQ#: From Quarter
• TQ#: To Quarter. Periods are mapped to quarters using a fixed logic. Periods 1 to 3 map to Q1, periods 4 to 6 map to Q2, periods 7 to 9 map to Q3, and periods 10 to 12 map to Q4.
When you run the report, the variables are replaced by the report year and the period details you specified on the prompt page. The variables can also be replaced by the year and period, as calculated when comparing results with past GL periods.
Hide Column
When you include columns in calculations, you may need an extra column to store an intermediate calculation result you do not want to display on a report. In this case, set Hide Column to Yes.
Period Type
This field indicates which period data to include in the column. There are four period types:
• Prompt
• Compare
• Quarter
• Compare Quarter
When you select Prompt, the column contains data for the year periods entered on the prompt page when running the report. For example:
• You run a report for 2011/01–2011/03. The measure type is Activity. The column contains the activity for the period 2011/01–2011/03.
• You run a report for 2011/01–2011/03. The measure type is OpenBal. The column contains the opening balance at the beginning of 2011/01.
• You run a report for 2011/01–2011/03. The measure type is CloseBal. The column contains the closing balance at the end of 2011/03.
When you select Compare, the column contains data from a prior GL period you want to compare with. Instead of showing the activity or balance for the report period entered on the prompt page, the program displays the balance of a previous reporting period. To define the prior period to report on, use the Compare type and Offset fields.
When you select Quarter, you can put columns with quarterly totals next to columns with monthly totals on the same report. Assuming your cube has months as periods, system logic translates the From Period entry to the corresponding quarter.
For example, period 2 belongs to quarter 1, period 8 belongs to quarter 3, and any period from 10 up to 14 belongs to Q4. The To Period entry belongs to a To Quarter in the same way. Therefore, if you run a report from period 1 to period 3, the report displays the results of Q1 in the Quarter column. However, if you run a report from period 3 to period 3, the report also displays the results of Q1 in the Quarter column. This enables you to produce a report with a column displaying last month's figures and another column with figures from the last quarter next to it. If a cube has only four periods, the period and quarter are treated as equal.
When you select Compare Quarter, you can also put columns with quarterly totals next to the previous quarter’s totals on the same report. The number of quarters entered in the period offset is subtracted from the calculated quarter. For example, if system logic finds Q2 based on the period selected, Compare Quarter with an offset of 1 returns the figures of Q1. If the logic finds Q1, Compare Quarter with an offset of 1 gives the figures of Q4 the previous year.
Compare type
When the Period Type field is set to Compare, this field lets you indicate what values to compare with. The options are:
• ReportPeriod: Compare with a previous report period. You can go back as many periods as there are in a report year.
• ReportYear: Compare with a prior report year. You can go back as many years as you want, as long as there is data for that year in the cube.
Note: The ability to compare data is only available if the reporting cube also spans this time frame. For that reason, it is recommended you maintain report cubes with data that spans two report years. For example, if you maintain a cube with data from 2009–2010 and 2010–2011, you have data from the prior year to compare in the same cube.
Offset
When the Period Type field is set to Compare, this field lets you enter the number of periods or years you want to go back for the comparison. For example, for a column, you specify:
• Period Type = Compare
• Compare Type = ReportPeriod
• Offset = 3
You then run a report for 2011/01 to 2011/03 and the measure type is Activity. The comparing column contains the activity for the period 2010/10–2010/12. When running the report, the program goes back three report periods relative to the selected period.
Formula
If you specify Calculated in the Measure Type field, enter a calculation formula in this field. Calculations are always performed using the values from other columns or using constants. The reference to a column in the calculation is in the format letter C followed by a column number with no leading zeros; for example, C9. Component columns must be part of the same column group. This restriction is not validated when you create the column group; only when you use the tree to run a report.
Analysis Code
This optional field allows you to specify a report analysis code. This is useful if you want to include side-by-side comparisons in the report. For example, to compare the balances of several entities side-by-side, you can create a special report analysis code for each targeted entity and create a column for each entity that contains the corresponding analysis code. As a result, only the balances of the targeted entities are displayed in each column.
You can do this for any dimension of the COA. You can compare entities, sub-accounts, cost centers, SAFs, GL accounts, layers, and other elements side-by-side in columns. The report analysis code must belong to the chart specified in the header of the report column group.
When you have entered all the detail fields for a column, the program prompts you to enter details for the next column. When you have finished, use F4 or the Back button to exit the program. Each column you have completed is automatically saved. You can also delete the last column of a group by entering delete in the Measure type field for the last column. This feature is not supported in other columns.