Browse Highlights
The Search options in Financials activities let you filter search results in a number of ways, and to save customized search settings for reuse. Whenever you view, modify, or delete a record created in a financial activity, you begin by launching a browse.
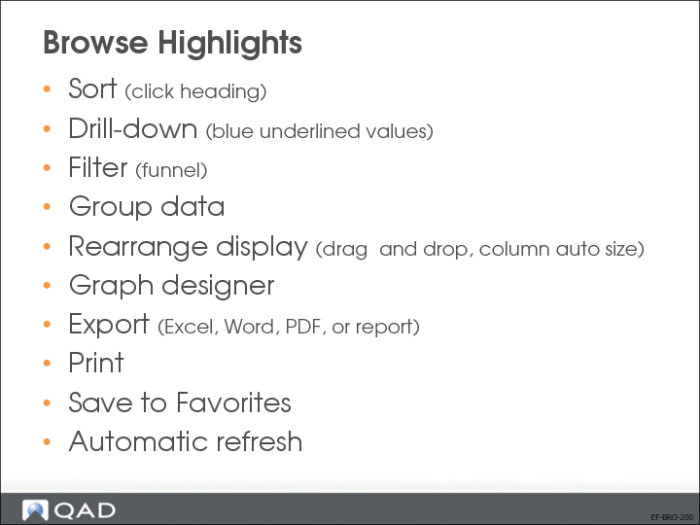
Browses provide many convenient features that let you manage search criteria and results in an efficient way. These features are described in the following pages.
Browse Features
• Sort
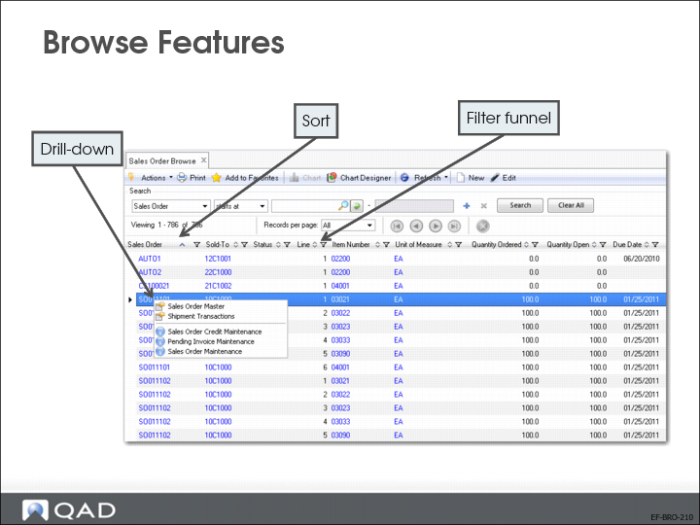
You can sort all data in a result list on any of the columns just by clicking the column header. Click the header again to sort the data in reverse order.
• Filter funnel
Each column features a drop-down filter option. Click the icon to display the available filters and specify the data to display.
• Drill-down
You can right-click any blue underlined record to access related functions.
Rearrange Display
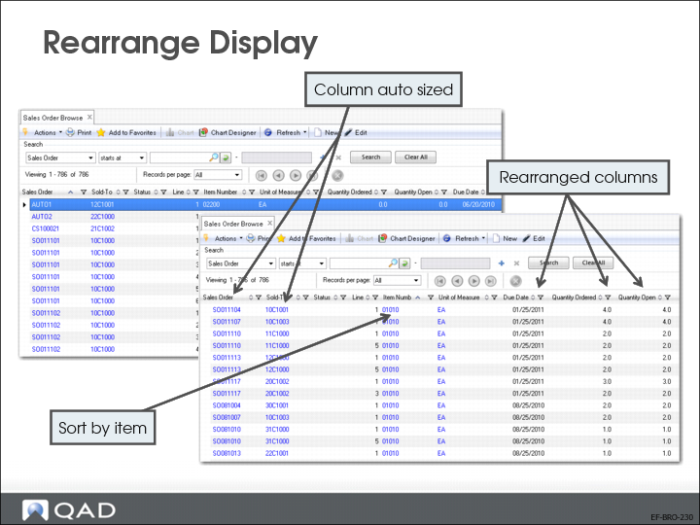
You can change the column order by clicking the column header in the browse screen and dragging it to another position in the results list. A red arrow indicates the place where that column will be dropped when you release the mouse button.
Browse Features
Adjust the column size by clicking on the border of the column header and dragging the border to the left or the right.
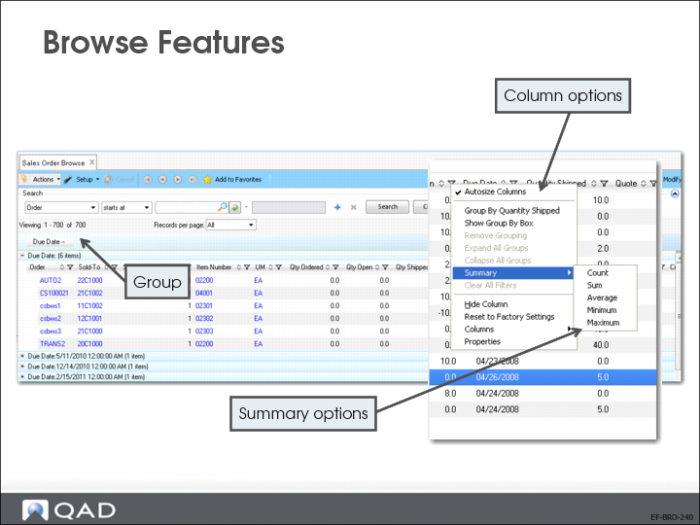
Make additional adjustments to column settings by right-clicking on any column header and choosing the Columns option.
• Group
Use the right-click Group option to group data by column type. The grid now displays a summary of the column data, with different elements sorted into groups. You can expand each group in the list using the plus sign next to the group.
• Summarizing results
The Summary option displays summary information, depending on the column header in which you have clicked, for example, count, sum, average, minimum, or maximum. Note that you will only see meaningful results if the operator you choose applies to the data type.
Chart Designer
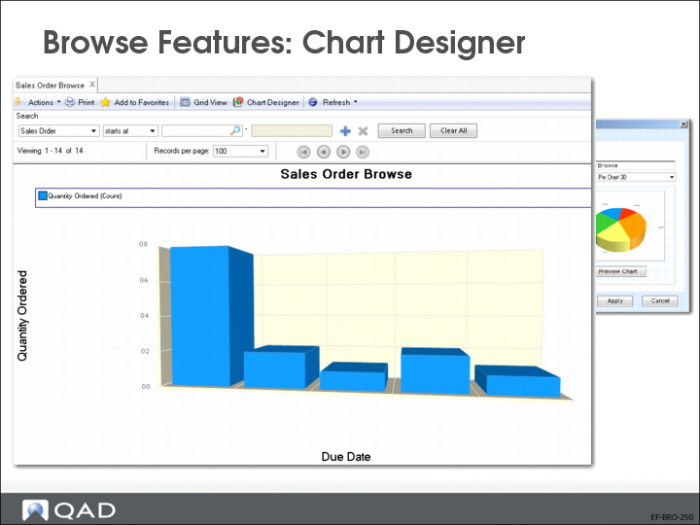
Using the browse Chart Designer feature, you can generate graphical representations of browse data. Toggle between the standard browse display (called the grid view) and the new chart view. Using the Chart View editor, you can select data in a browse and display it as a pie chart or bar graph.
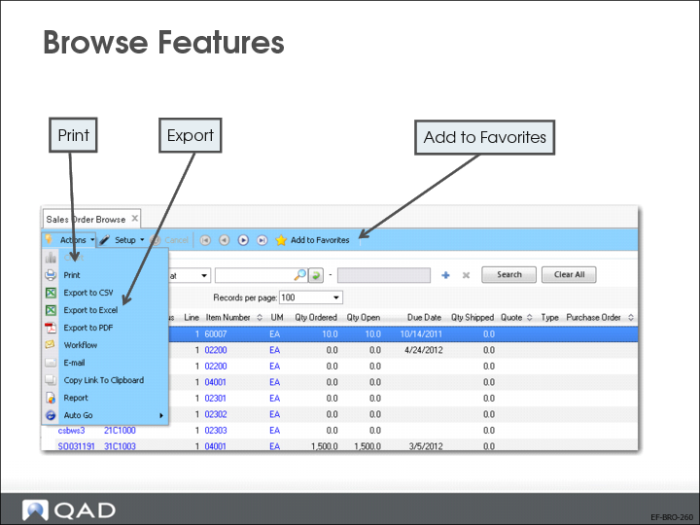
You can export, print, and refresh browse results by clicking the buttons on the menu toolbar.
You can save a browse with specific search criteria to your Favorites.
US and EMEA Exercise: UI Navigation
In the US, log in to entity 10USACO. In EMEA, log in to entity 22UKCO.
1 Log on to QAD Enterprise Applications using the username and password provided by your instructor.
a Familiarize yourself with the interface.
b Click menu options and go down the menu tree.
c Open your inbox.
d Change the active workspace.
2 Look for the menu item Sales Order Browse.
Note: Remember the four options to search for a menu item.
a Look for the menu number. Right-click the menu name and select Properties.
b Add Sales Order Browse to your Favorites.
c Rename Sales Order Browse in your Favorites pane.
3 Open Sales Order Browse.
a In the header Records per page field, select All.
b Choose a column heading to sort on and click the column heading (for example, Due Date).
c Move some columns around (drag and drop) to update the layout.
d Filter the data, for example, by item number, by clicking on the Funnel icon.
e Right-click a sales order number. Choose Sales Order Master and review the record.
f In the Sales Order Browse, right-click a column header and select Show Group By Box.
g Drag and drop the Due Date column header to this area. Click a + sign to drill down.
h Drag and drop the Item Number column header to this area.
i In the menu bar, click Actions|Export|Export to Excel and save the Excel file to your desktop.
j Review the Excel file you exported.
The grouping is preserved.
k Return to the Sales Order Browse, and set the Records per page field in the header to 10.
l In the Setup menu, choose Chart Designer and specify the following values to create a chart:
X Variable: Select Due Date.
Y Variable: Select Qty Ordered.
Chart Type: Select Column Chart 3D
m Click Apply to create the chart.
4 Open GL Account Excel Integration (25.3.13.5).
a In the grid area, right-click and choose Load Accounts.
b When the accounts have loaded, right-click in the grid again and choose Columns.
c Select the columns that you want to export. Deselect the ones you do not want to export.
d Click Save.
e Right-click in the grid and select Export to Excel for Maintenance.
f Review the data in the exported Excel file.
Look at row 2. It contains important information for the system to reload the data after maintenance. Do not modify the data on this row.