Process Maps
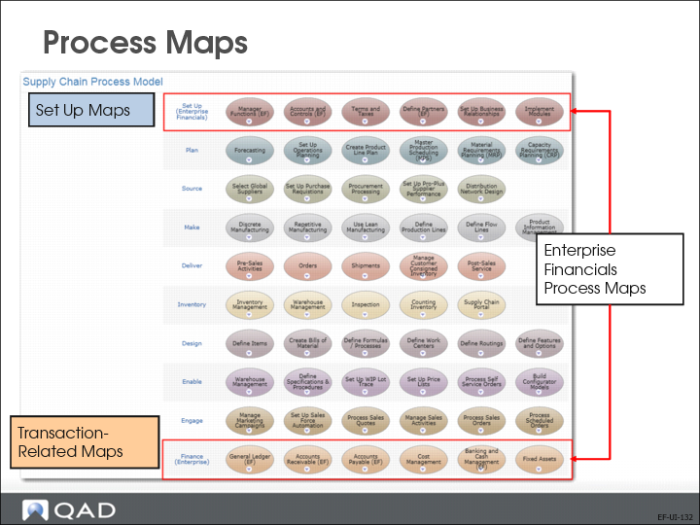
Process maps illustrate the principal business and operational processes within a QAD application, and consequently, provide graphical navigation. The maps are graphical models of workflows that link to programs, browses, and other process maps.
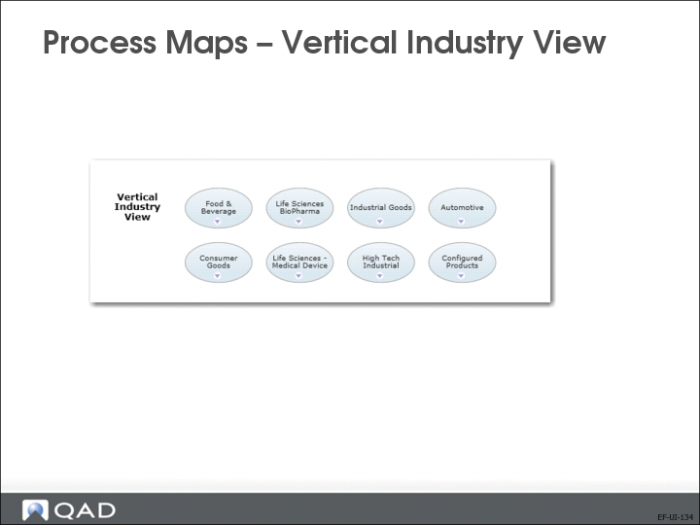
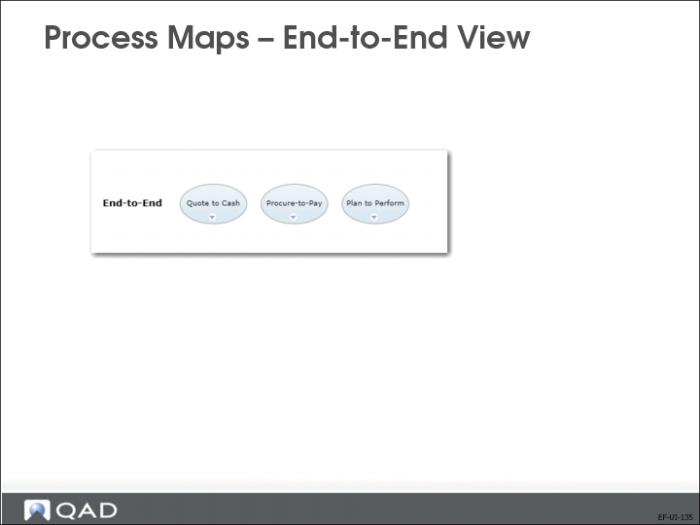
There are three separate views for process maps in QAD applications: the Supply Chain View (shown above), the End-to-End view, and the Vertical Industry View.
The Vertical Industry maps are categorized using eight groups:
• Food and Beverage
• Life Sciences BioPharma
• Industrial Goods
• Automotive
• Customer Goods
• Life Sciences – Medical Devices
• High Technology Industrial
• Configured Products
The Vertical Industry maps eventually link to the same lowest level maps as the Supply Chain View.
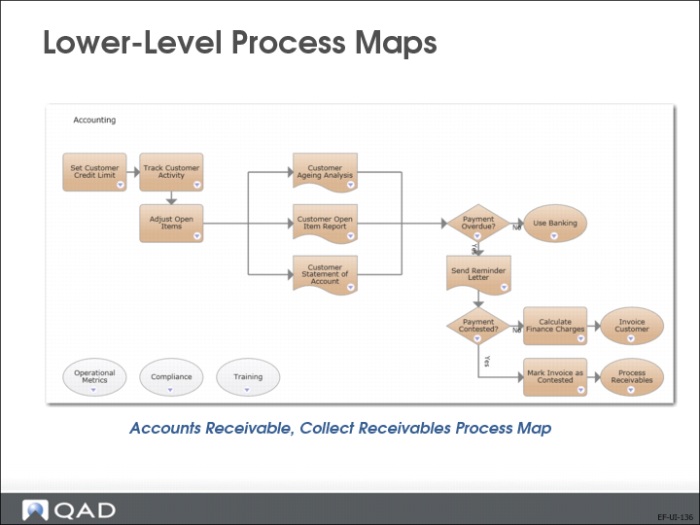
Lower-Level Process Maps
Detailed Enterprise Financials processes are illustrated using the Finance process maps. At the lowest level in the maps, you can click task nodes to open programs, views, and reports in the QAD Enterprise Financials application.