Application Integration
Two powerful features facilitate data exchange between systems, record creation, maintenance, and reporting. These features are XML integration and advanced Excel integration.
XML Integration
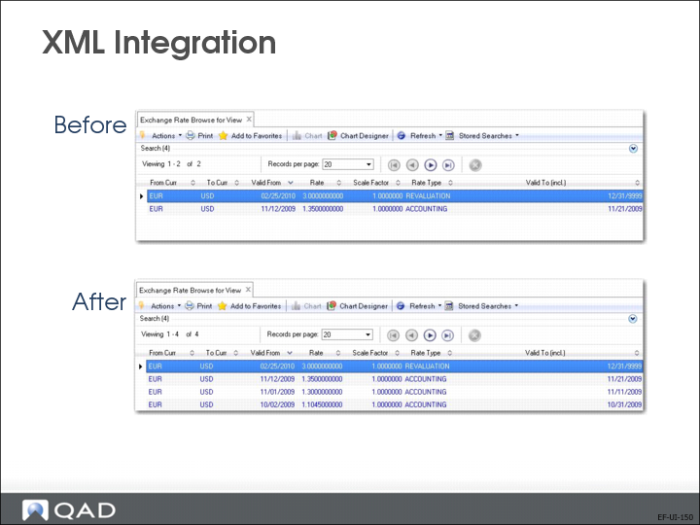
XML is mainly used to upload data at the start of an implementation, or to automatically load data, such as exchange rates, that must be imported on a regular basis.
XML integration is very flexible and easy to manage. Refer to User Guide: QAD System Administration.
Advanced Excel Integration
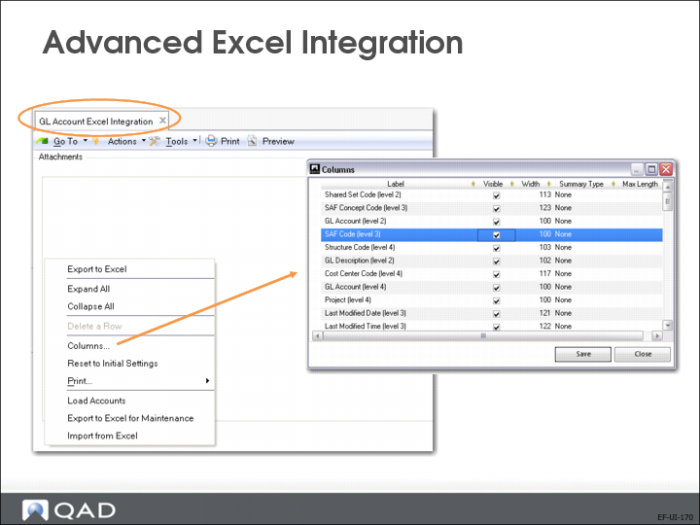
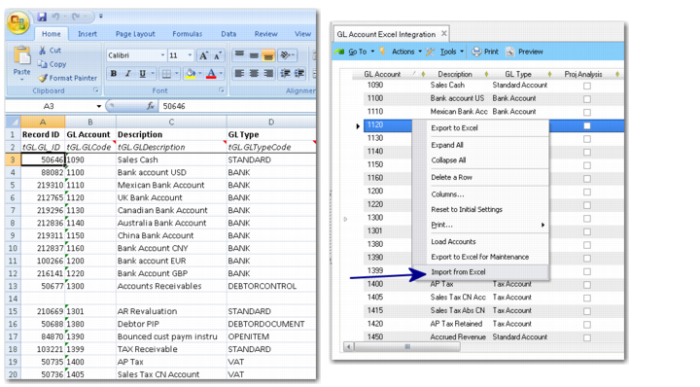
Several menus allow for two-way Excel integration. This facilitates the setup, but also batch changes.
• With advanced Excel integration, you can export all records for remote maintenance, modify the data, and re-import the saved results into the system database.
• Create a blank template that consists of column headings for all fields in a business component and export the template for remote maintenance. You can then create the data in the spreadsheet or load data from another application into the template to import it to the system database.
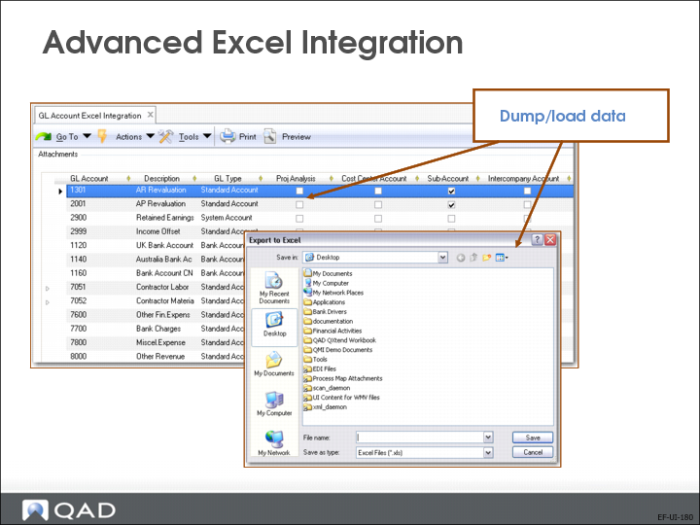
Steps for dump and load include:
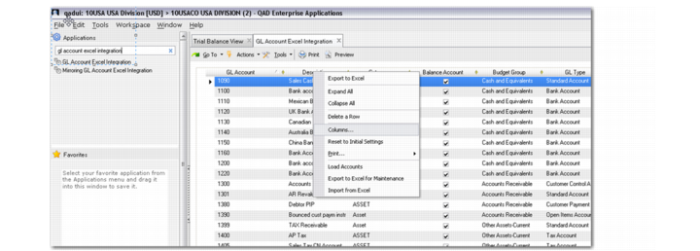
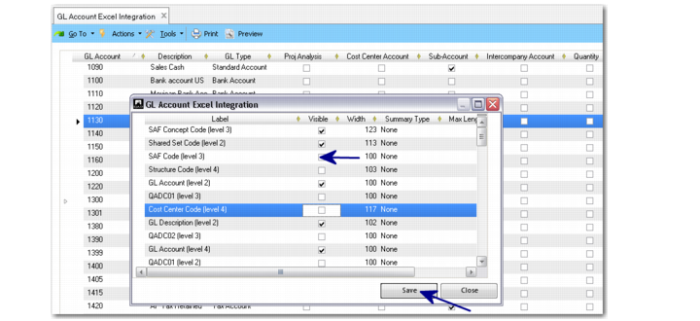
1 Select columns to export data for modification.
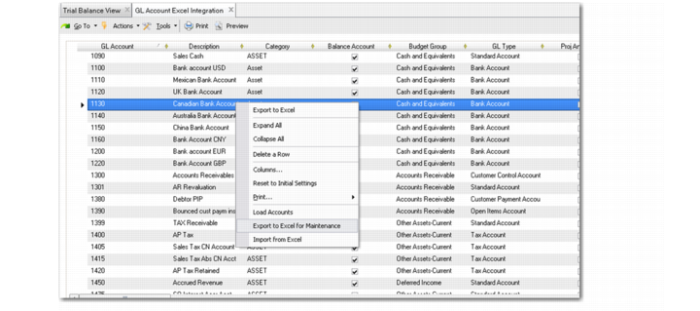
2 Export to Excel for Maintenance.
3 Modify or enter data.
4 Re-import to QAD Enterprise Financials.
Advanced integration with Excel is available as a menu activity for the following business components:
• Alternate COA Group
• Alternate COA Structure
• Business Relation
• COA Cross Reference
• Cost Center
• Cost Center Mask
• Country
• County
• Credit Terms
• Customer
• Daybook
• Employee
• End User
• Exchange Rate
• GL Account
• Journal Entry
• Mirroring Daybook
• Mirroring GL Account
• Payment Formats
• Project
• Project Mask
• Reporting Daybook
• SAF Code
• SAF Concept
• SAF Structure
• State
• Sub-Account
• Sub-Account Mask
• Supplier
You do not have to exit the QAD application before working in Excel. For minor maintenance, it is more convenient to run the applications simultaneously, and to switch back to your QAD application to import the saved data.
You can also use Excel integration when maintaining budgets. In the Budget module, the integration is maintained in real-time and is referred to as a hotlink. This feature is discussed in more detail in the Advanced Financials class.
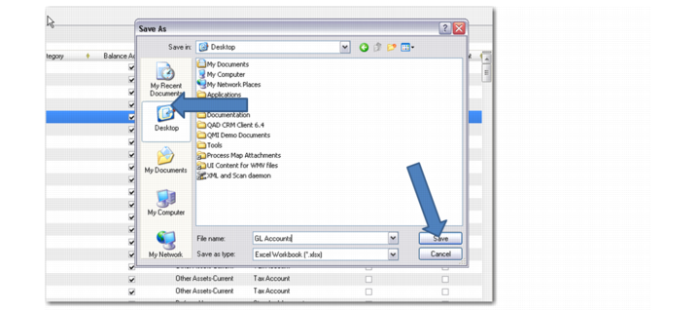
To export data for maintenance, choose the Excel integration activity for one of the supported record types, such as GL Account. Select a dump location. In the Excel worksheet, make changes or add data, and save. Then return to the application and import the modified data. The system validates any data before importing it. For example, if a mandatory field is missing, the record cannot be imported.
The Excel integration function is described in full detail in the Advanced Financials class.
Browse Results
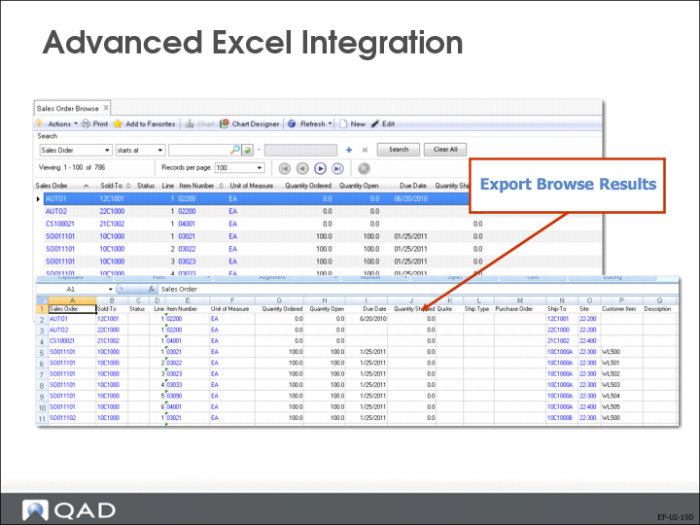
Browse results can also be easily exported to Excel. To export data directly into an Excel spreadsheet, right-click the results screen, and choose Export to Excel from the Actions menu.
The browse results are displayed in a new Excel window. The formatting of the original grid is preserved in the new spreadsheet.
Note: This data cannot be re-imported into the database.
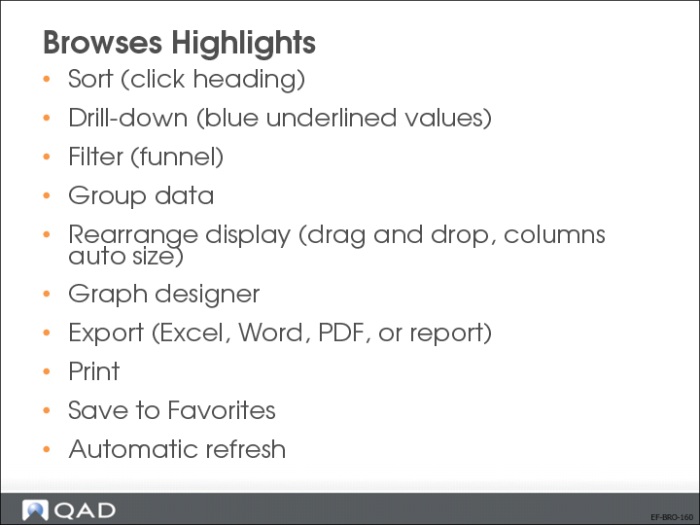
Browse Highlights
The Search options in Financials activities let you filter search results in a number of ways, and to save customized search settings for reuse. Whenever you view, modify, or delete a record created in a financial activity, you begin by launching a browse.
Browses provide many convenient features that let you to manage search criteria and results in an efficient way. These features are described in the following pages.
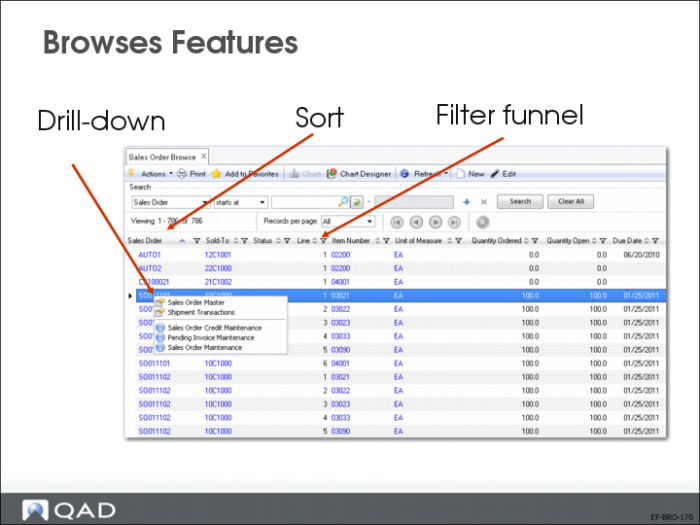
Browse Features: Filter Funnel, Sort, Drill-Down
• Sort
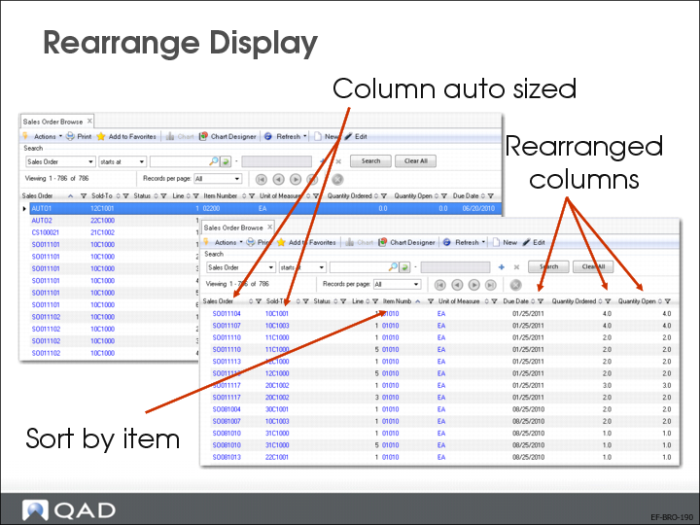
You can sort all data in a result list on any of the columns just by clicking the column header. Click the header again to sort the data in reverse order.
• Filter funnel
Each column features a drop-down filter option. Click the icon to display the available filters and specify the data to display.
• Drill-down
You can right-click any blue underlined record to access related functions.
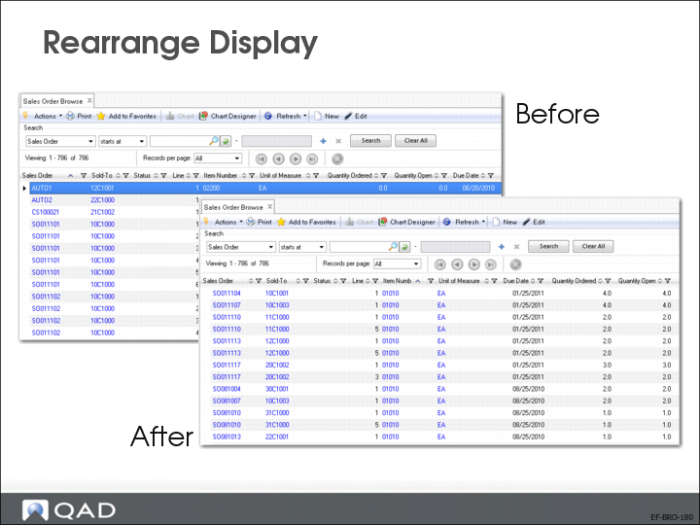
Rearrange Display
You can change the column order by clicking the column header in the browse screen and dragging it to another position in the results list. A red arrow indicates the place where that column will be dropped when you release the mouse button.
You can also adjust the column size by clicking on the border of the column header and dragging the border to the left or the right.
Browse Features: Group, Column Options, Summary Options
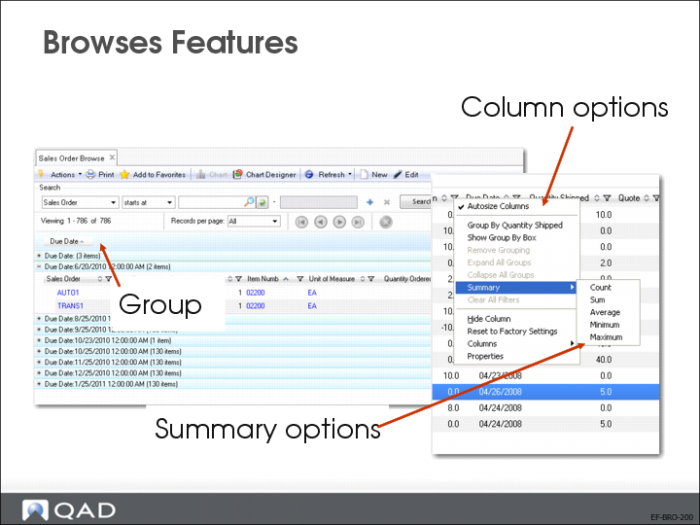
You can make additional adjustments to column settings by right-clicking on any column header and choosing the Columns option.
Group
Use the right-click Group option to group data by column type. The grid now displays a summary of the column data, with the different elements sorted into groups. Each group in the list can be expanded using the plus sign next to the group.
Summarizing results
The Summary option lets you display summary information, depending on the column header in which you have clicked: count, sum, average, minimum, or maximum.
Note: You only see meaningful results if the operator you choose applies to the data type.
Browse Features: Export, Print, Favorites, Refresh
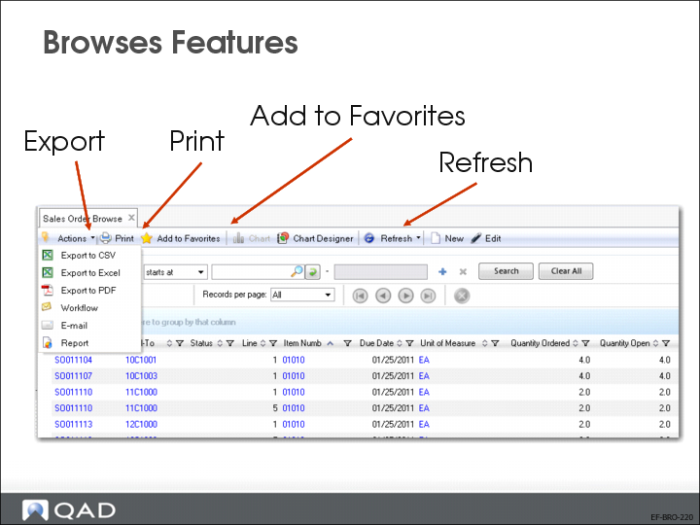
Conveniently, browse results can be exported, printed and automatically refreshed by clicking on the buttons on the menu toolbar.
You can also save a browse with specific search criteria to your Favorites.
Chart Designer
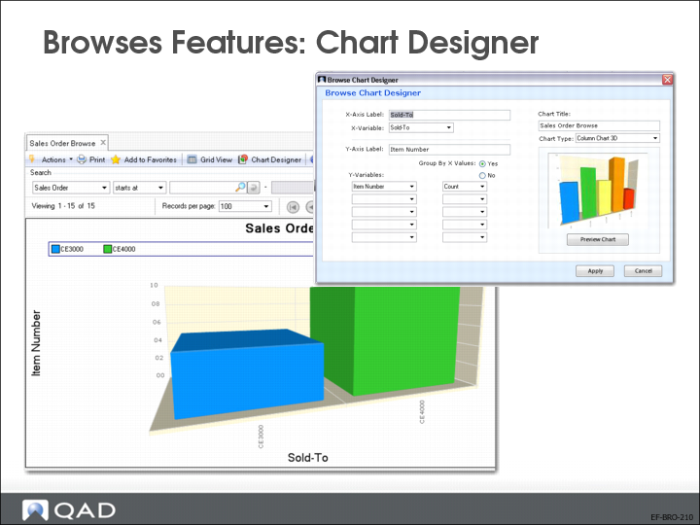
Using the browse Chart Designer feature, you can quickly generate graphical representations of browse data. You can toggle between the standard browse display (called the grid view) and the new chart view. Using the Chart View editor, you can select data in a browse and display it as a pie chart or bar graph.
Hands On Exercise: UI Navigation
Logon to QAD Enterprise Application with the credentials given by your instructor.
• Familiarize yourself with the interface.
• Click menu options and go down the menu tree.
• Open your inbox.
• Change the active workspace.
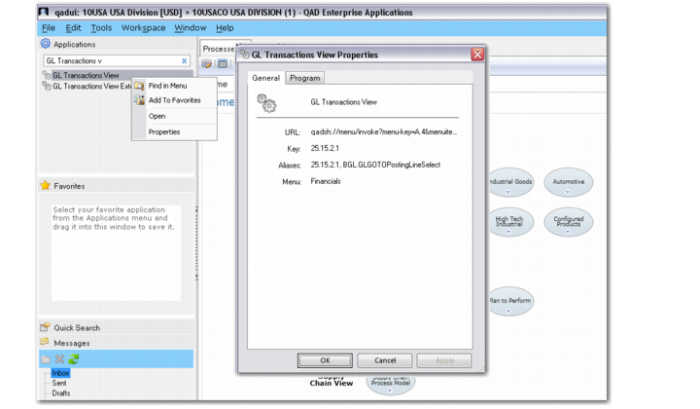
1 Look for GL Transactions View (25.15.2.1). Remember the options to search for a menu.
a Look for the menu number. To obtain the menu number for a function, right-click the menu name and select Menu Properties.
GL Transactions View Properties
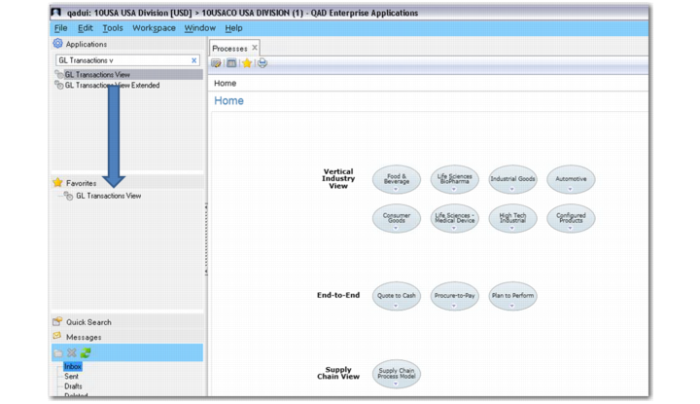
b Add GL Transactions View to your Favorites (drag and drop).
Add to Favorites
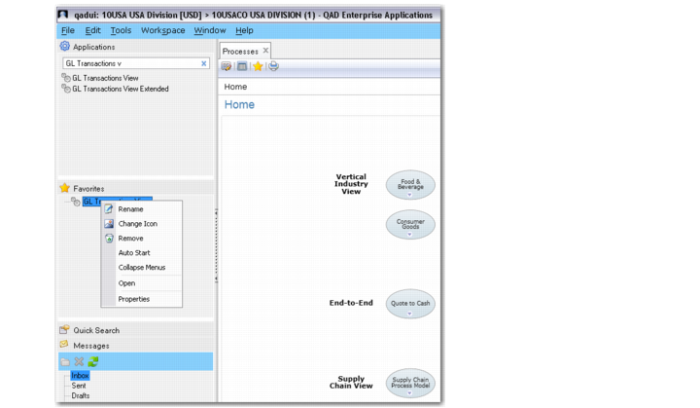
c Rename GL Transactions View in your Favorites pane. Right-click the menu in the Favorites pane, and click Rename.
Rename
2 Open Trial Balance View (25.15.2.9).
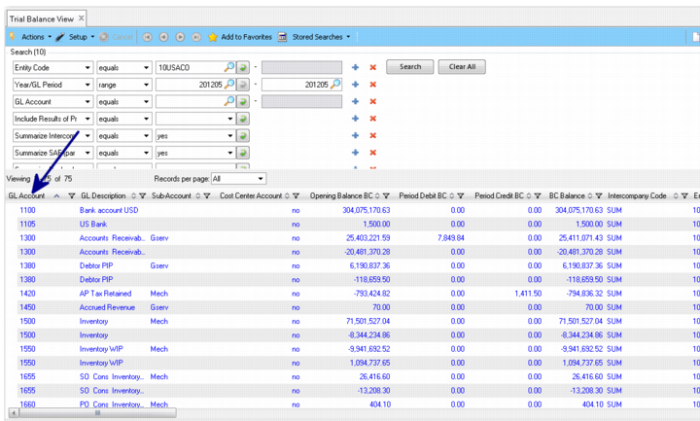
a Click one heading to sort, for example, GL Account.
Trial Balance View, GL Account Column
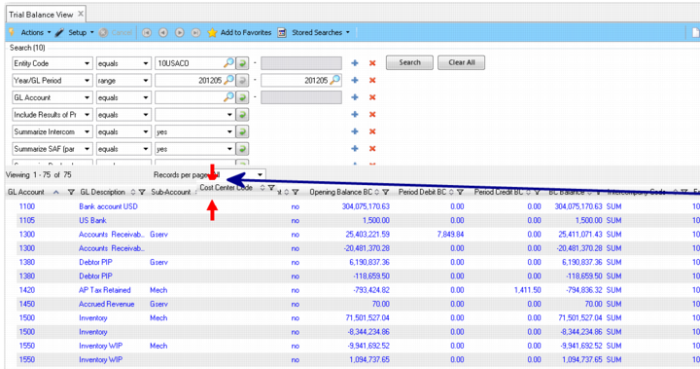
b Move columns using drag and drop to create a more sensible display.
Trial Balance View, Repositioned Column
3 Filter the data in Trial Balance View (25.15.2.9).
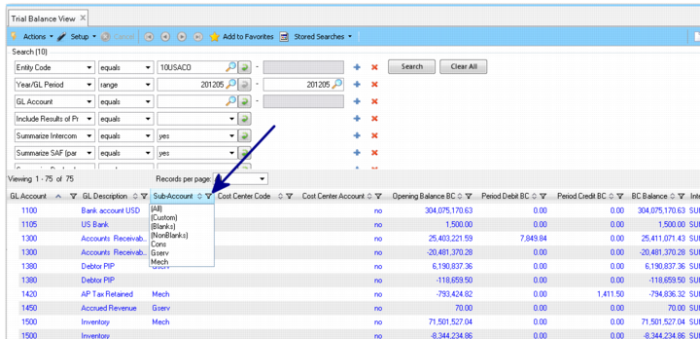
a Try filtering the data, for example, by sub-account (click the Funnel icon). Now, try to remove the filter you added.
Trial Balance View, Data Filters
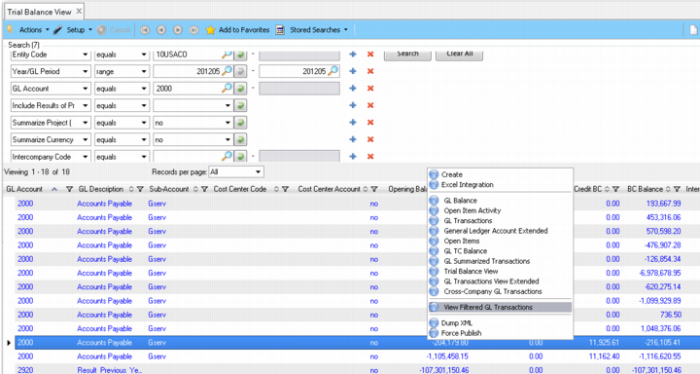
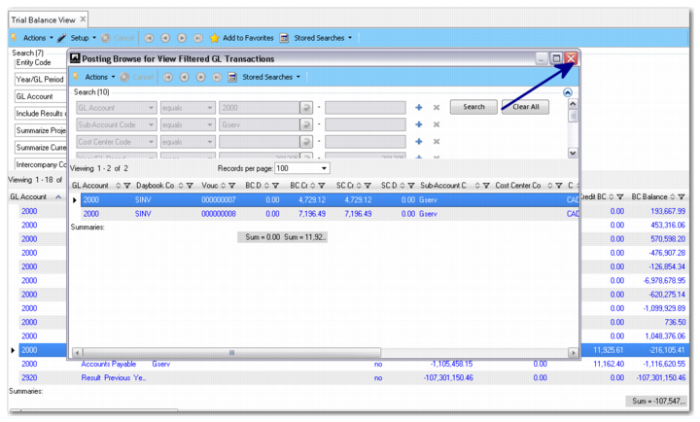
b Add a filter to search for GL Account = 2000, and then click the Search button. Right-click account 2000 and select View Filtered GL Transactions.
Trial Balance View, Right-Click Menu
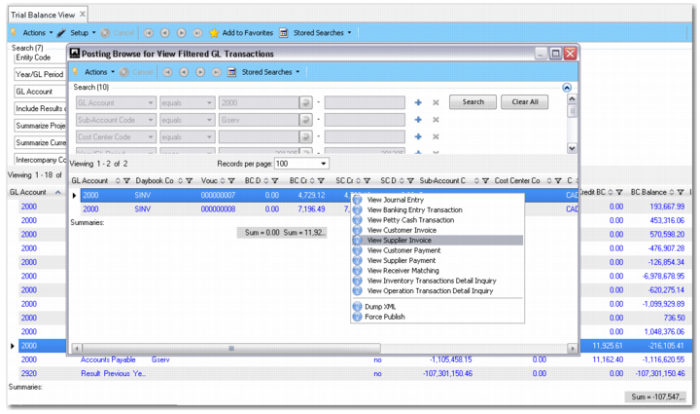
c Right-click one of the GL transactions and select View Supplier Invoice.
Trial Balance View, Right-Click Menu
d Return to Trial Balance View by closing the pop-up window.
Trial Balance View
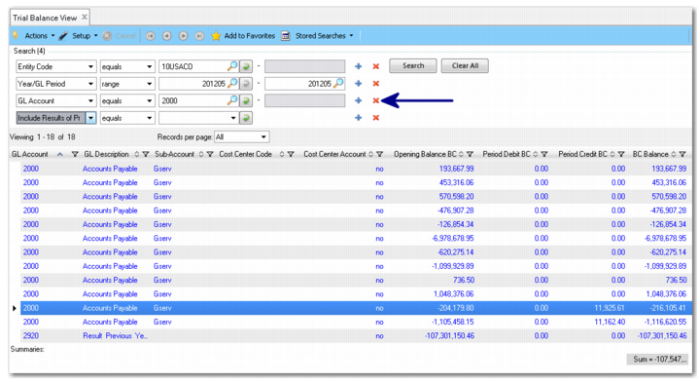
e Remove the GL Account = 2000 filter by clicking on the x beside it. Then, click Search.
Trial Balance View, Search
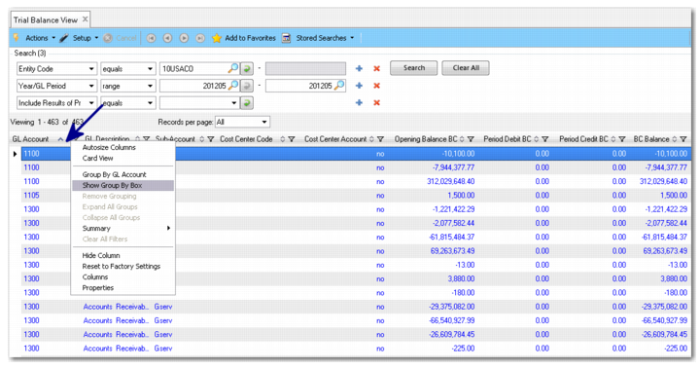
f Right-click any column header and select Show Group By Box.
Trial Balance View, Search
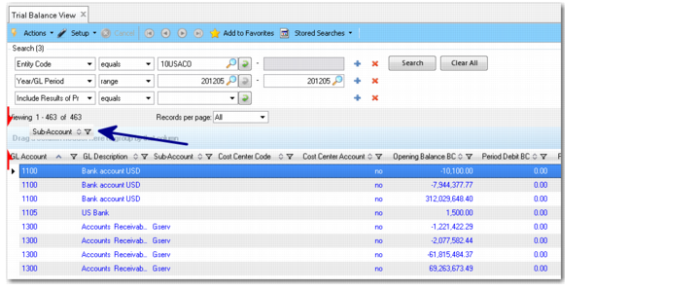
g Drag and drop the Sub-Account column to the blue area at the top of the columns.
Trial Balance View, Group by Sub-Account
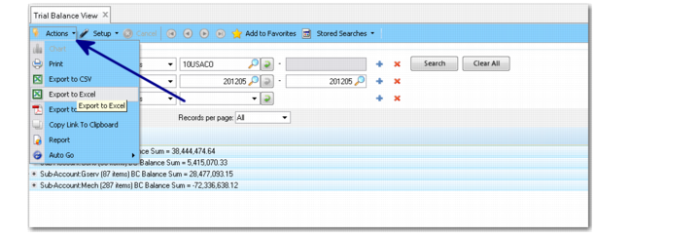
4 Export the browse data to Excel.
a In the menu bar, click Actions, then Export to Excel.
Export to Excel
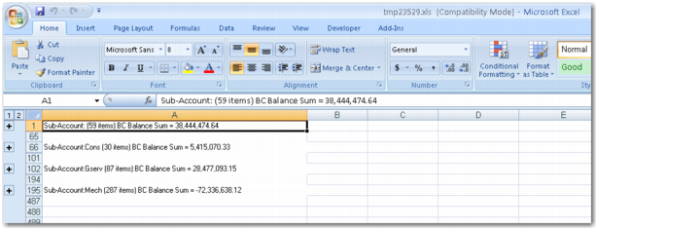
b Review the Excel worksheet. The grouping is preserved.
Exported Excel Data
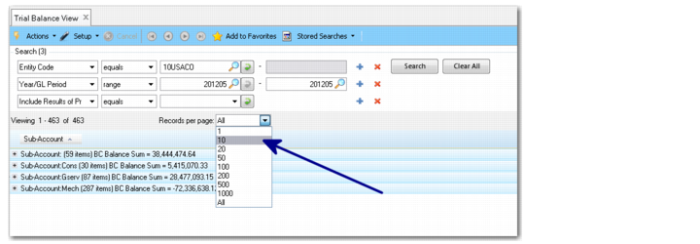
5 Go back to the application. Records per page: select 10
Records per Page
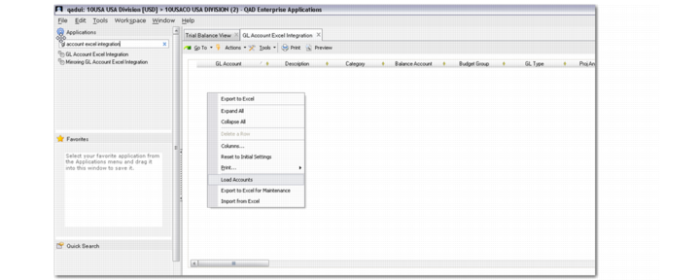
6 Go to the menu GL Account Excel Integration.
a Right-click and select Load Accounts.
Load Accounts
b Right-click any column and select Columns.
Columns
c Select the columns that you would like to export. Deselect the ones you do not want to export.
Columns for Export
d Right-click and select Export to Excel for Maintenance.
Export to Excel
e Save the file to your desktop.
Save File
f Review the data. Look at row 2. It contains important information for the system to reload the data after maintenance. Do not modify the data on this row.
Review the Data
g Now you can modify the data, and re-import it to the system. (Do not re-import the data at the current time to avoid creating issues in the database that might prevent you from completing the other exercises in this course).