Report Analysis Codes
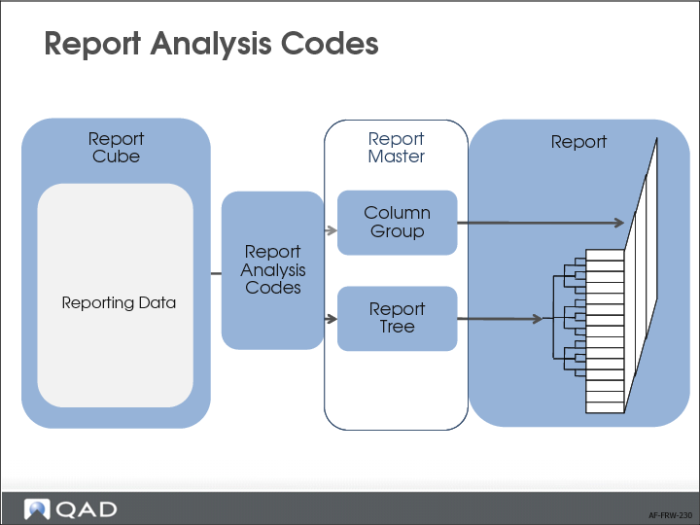
To create a report, you must create four components:
• Report analysis codes
Report cube data is stored for each combination of COA elements. This means that a report cube can contain thousands of combinations of COA elements.
When building a report, it is not very convenient to specify all these combinations individually. Therefore, you can create a new object called a report analysis code. Each analysis code contains a set of filters on the accounting dimensions so that data can be retrieved selectively from the cube.
The report analysis codes are the elementary building blocks for a report tree and, in some cases, for column groups.
• Report tree
A report tree represents the hierarchy of a report. You build a report tree using report analysis codes as building blocks. Report trees are reusable in multiple reports, and can be built recursively from smaller trees.
• Column group
In a column group, you define of a set of columns that you want to see on a report.
• Report master
The report master brings together all the elements required to run a report. In the report master, you can combine a report tree with a column group and give the report a meaningful title. The report master also lets you apply security to a report.
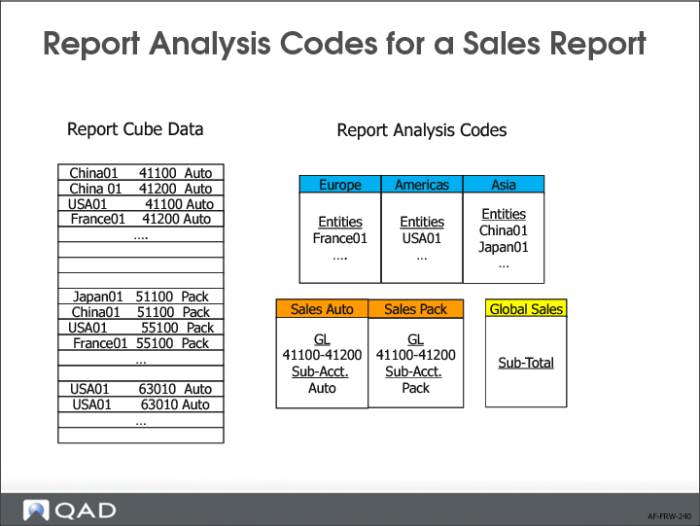
In the example of the Global Sales report, we first create report analysis codes. For each of the regions Europe, Americas, and Asia, we create a report analysis code that lists the entities that belong to the region.
Next, we need two analysis codes for Sales Automotive and Sales Packaging.
• The GL account range 41100 to 41200 contains the sales accounts.
• The sub-accounts Auto and Pack represent the automotive and packaging divisions of the company.
For each report analysis code, you link the appropriate GL account range and sub-account to it.
We also need a report analysis code that represents the global sales total. This analysis code has type S (sub-total) and no COA details.