Creating Cash Reports
Use Cash Flow Report Create (31.8.1) to design your cash flow report.
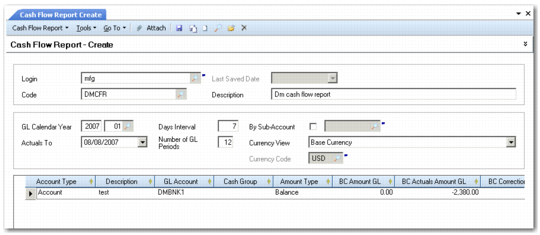
Cash Flow Report Create
Field Descriptions
Login
This field displays the login ID of the current user.
Last Saved Date
This field indicates the date on which the report was last saved.
Code
Enter a code (maximum 20 characters) to identify the report.
Description
Enter a brief description (maximum 40 characters) of the report.
GL Calendar Year
Specify the GL calendar cut-off year and period. The system checks the account balances on the last day of this period, which is also called the cut-off date. This is also the date on which the cash flow projection begins.
Example: To monitor account balances on May 31, 2014, and to project the cash flow over the months June, July, and August 2014, specify 2014 05 as the cut-off year and period. The account balances for May 31 are displayed, and the cash flow projection begins on June 1. When you set a Days Interval of 7 (for weekly intervals), the first interval date is 6/7, the next is 6/14, and so on.
Days Interval
Set the number of days for each interval in the projection. For example, a weekly interval is 7 days.
By Sub-Account
Specify a sub-account for sub-account analysis. In this case, the system checks for movements and balances on accounts for which the sub-account is defined.
Actuals To
Specify a date by which the system retrieves actual activity on the account. This date must be later than the GL cut-off year or period. The date defaults to the current date.
The system shows a separate total (BC Actuals Amount GL) for account activity that occurred between the end of the GL calendar cut-off period and the date specified in Actuals To. In addition, projected cash flows from AR and AP control accounts (based on open item due dates) are corrected using the payments that occurred in the same interval. Therefore, the system displays the actuals as of the end date of the cut-off GL period.
Number of GL Periods
Specify the number of periods in the cash flow projection, to a maximum of 31.
Currency View
Select base, management, or transactional as the currency view for the report. When you select the transactional currency, the Currency Code field is available to select a specific currency. The system only retrieves transactions in the currency you select. For example, if you select the euro currency, only transactions that have been created in euros are retrieved.
Currency Code
Specify a transactional currency in which to view the report. This field is only available when you select transactional currency as the currency view.
Grid
Right-click to enter a new line on the grid.
Account Type
Select Account or Manual as the type of entry in the cash flow report.
Account: You specify an account code in the GL Account field, and this account is included in the projection.
Manual: Manually enter an amount into a projection interval. You do not select a GL account for this type. This option lets you enter occasional or one-time costs or expenses into an interval, such as banking fees or asset sales.
Description
Enter a description (maximum of 40 characters) for the report.
GL Account
Specify the GL account to be monitored during the projection. You can include any type of GL account in the report.
Cash Group
This field indicates the cash group to which the account belongs, if any. You use cash groups to categorize accounts; specify the cash group for the account on the account Report Link tab. See
Report Link Tab.
Amount Type
This field indicates the amount type, which depends on whether the account is a balance sheet or profit and loss account.
Balance: The grid displays the balance on the account as of the cut-off date. Balance sheet accounts automatically display balances in the grid.
Activity: The grid displays the total of all movements on the account for the cut-off period. Profit and loss accounts automatically display activities in the grid.
BC Amount GL
This field displays the current account balance. The amount is recalculated when you modify the cash flow settings; for example, by extending the cash flow period to include intervals in which movements on the account take place.
BC Actuals Amount GL
This field displays the total of all activity on the account between the cut-off period end date and the Actuals To date.
BC Correction Amount GL
Enter a correction amount to adjust the account balance. Use this option to account for large, one-time liabilities or assets that are due in the projection period but for which there is no system open item.
(Non) Cumulative
Select cumulative or non-cumulative as the calculation method for the cash flow. The method applies to this line only, and you can include a mix of both methods in the final report.
Cumulative: The grid displays the total of the account balance and the activities on the account in the interval.
(Non) Cumulative: The grid displays the movements on the account only in the interval.
% GL Period
This field displays the percentage increase on the total account balance that is forecast for this interval.
Example: The monthly debit on a salary account is $100,000. You expect this figure to increase by 6% over the year to allow for annual wage increases. To account for this additional 6%, you define a .5% increase for each of 12 monthly intervals (100.5%, 101%, 101.5%, and so on). The account balance now reflects the cash flow for that interval while allowing for the annual increase.
You cannot apply a percentage to control accounts.
Amount Period
This field displays the account balance forecast for the interval. Accounts display a negative amount for outgoing movements, and a positive amount for incoming movements.
Click Recalculate to retrieve actuals and calculate intervals. Right-click on the report grid to export the report to Excel.