Setting Up KPIs
To set up a KPI, perform these steps:
1 Set up KPI calculation elements.
2 Create KPI slices to allow you to view the KPI by dimension type.
3 Define a KPI composed of KPI elements.
4 View and analyze the KPI using the KPI Monitor (25.22.2.5).
Example: To create a KPI to measure Working Capital Turnover Ratio, use the formula:
Working Capital Turnover Ratio = Net Sales/(Current Assets - Current Liabilities)
1 Set up KPI elements for net sales, current assets, and current liabilities.
2 Create a KPI slice of type entity to view the ratio by entity.
3 Define a KPI named Working Capital Turnover Ratio.
4 View the Working Capital Turnover Ratio and analyze the overall ratio and the ratio by entity using the KPI Monitor (25.22.2.5).
Setting Up KPI Calculation Elements
KPI Element Create (25.22.1.1) enables you to create the elements that make up the formula for a KPI. Each element is a report analysis code or a constant. The element must already be defined within Financial Report Writer.
Example: To create a KPI to measure Working Capital Turnover Ratio, the formula is:
Working Capital Turnover Ration = Net Sales/Working Capital
Working Capital = Current Assets - Current Liabilities
Working Capital Turnover Ratio = Net Sales/(Current Assets - Current Liabilities)
Therefore, you need to create three KPI elements in KPI Element Create:
• Net Sales
• Current Assets
• Current Liabilities
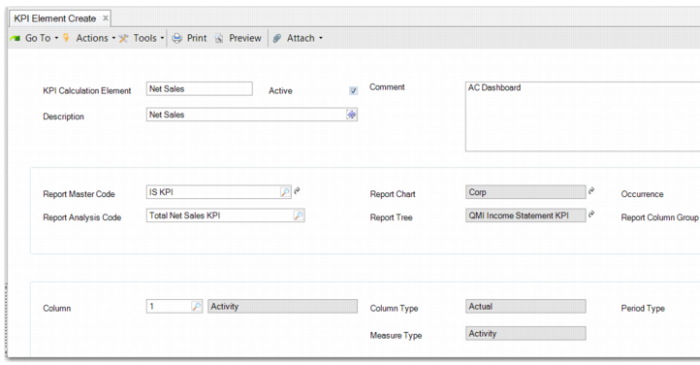
KPI Element Create
KPI Calculation Element
Enter a meaningful code for this element.
Description
Enter a meaningful element description.
Active
The element is only active and available to use when you select this field.
Comment
Optionally, enter a comment with further details on the element.
Report Master Code
Select an existing report master. When you select the report master, the Report Chart, Report Tree, and Report Column Group fields are populated automatically.
Report Analysis Code
From the lookup, select a report analysis code for use in this element. The analysis codes are displayed in the lookup as nodes within the report master. Double-click a node to select it. You can also select a column to include. You can only select one column.
Column
The column field is automatically updated when you select a report analysis code. However, you can also select a column manually to include in the element. For example, the columns available might be Budget and Activity. When you select a column, the Column Type, Measure Type, and Period Type fields are all populated with read only information from the Financial Report Writer setup.
When you have completed the fields, click Save. You can also modify, delete, and view KPI elements on the KPI Element menu (25.22.1).
Creating KPI Slices
KPI slicing categories enable you to analyze a KPI value in more detail. For example, you can analyze a KPI in different entities by defining a slicing category with the entity values you are interested in. Or you can define a slicing category with type cost center so you can analyze the KPI in different cost centers. For each slice that you add to the grid, this slice becomes a drill-down into the KPI.
The slicing category types are:
• Report analysis code
• Entity
• GL account
• Sub-account
• Cost center
• Project
• SAFs.
If the type is report analysis code, you can specify the report analysis codes you want to filter on in the Slices grid.
Example: You want to analyze a KPI by region. You first create three report analysis codes representing the regions named Americas, Europe, and Asia-Pacific.
Each report analysis code contains the list of entities for the region. Now you can create a KPI slice category named Region with the type report analysis code and list the three analysis codes Americas, Europe, Asia-Pacific under it. These slices allow you to analyze a KPI by region.
Example: You want to analyze a KPI by entity. You do not need to create analysis codes for each entity. You can immediately create a KPI slice category named Entity with the type Entity. These slices allow you to analyze a KPI by entity.
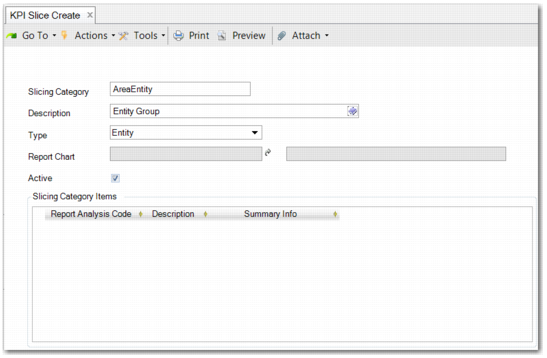
KPI Slice Create (25.22.3.1) enables you to create a KPI slice.
KPI Slice Create
Slicing Category
Enter a meaningful code for the slicing category.
Description
Enter a slicing category description.
Type
Choose the dimension that you want to create a slice for. For example, if you choose Entity, all the entities defined in the report chart that are included in KPI Element Create become part of the slice. The grid becomes actives when you select Report Analysis Code as the type. In the grid, you can add multiple report analysis codes—slice values—that will be subsequently displayed in the KPI chart.
Report Chart
This field only becomes active when you select Report Analysis Code as the type. Specify a report chart to enable a drill down for each value in the report chart based on the analysis code.
Active
Select this field to make the KPI slice active.
When you have finished defining the KPI slice, click Save. You can also modify, delete, and view KPIs slices on the KPI slice menu (25.22.3).
Defining KPIs
After you set up the KPI elements, you can then use these elements to define the KPI. KPI Create (25.22.2.1) enables you to create a new KPI and link KPI slices to it.
Example: You want to create a KPI to measure Working Capital Turnover Ratio. The formula is:
Working Capital Turnover Ration = Net Sales/Working Capital
Working Capital = Current Assets - Current Liabilities
Working Capital Turnover Ratio = Net Sales/(Current Assets - Current Liabilities)
When you have created the KPI elements, you can use them to define a KPI named Working Capital.
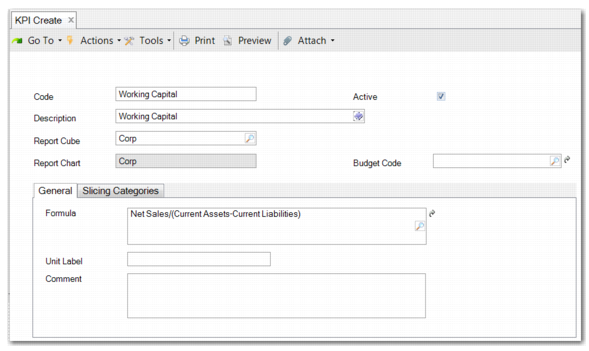
KPI Create
Code
Enter a meaningful code to identify this KPI.
Active
Select this field to make the KPI active.
Description
Enter a meaningful description for this KPI.
Report Cube
Enter the source report cube for this KPI. The cube must be linked to the same report chart as the report analysis codes used in the calculation elements. The Report Chart field is read only. It is populated automatically when you select a report cube.
Budget Code
Depending on the type of KPI, it can include a budget for comparison purposes. If your KPI is measuring actual values against budget targets, enter a budget code to use to retrieve budget KPI values.
The General tab contains the following fields:
Formula
Enter the KPI formula in this field. The formula contains KPI elements that you have created to use with this KPI. You can use the lookup to view the KPI elements that are available to use. Only KPI elements within the selected report cube are displayed in the lookup.
Unit Label
Enter a unit label to include on the KPI charts and graphs. The unit label indicates the meaning of the KPI values displayed as a result of the calculation; for example, $, EUR, or %.
Comment
Optionally, enter a comment with further details on the KPI.
On the Slicing Categories tab, you can add slice dimensions to the grid. These slices enable you to split an overall KPI value into slices, with the ability to drill down into a KPI value to view entity or cost center level amounts, for example. You can add any KPI slice that you have created in KPI Slice Create.
Click Save when you have finished defining the KPI. You can also modify, delete, and view KPIs on the KPI menu (25.22.2).
Analyzing KPIs
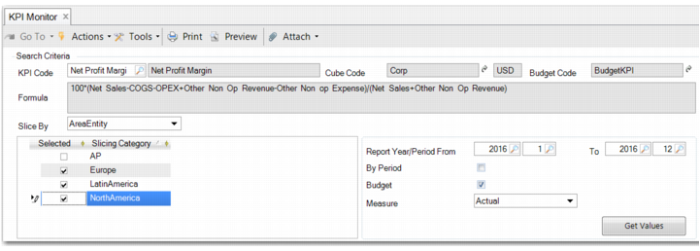
The KPI Monitor (25.22.2.5) enables you to view and analyze KPI values. You can display amounts and charts according to the slicing categories that you choose. You can also drill down into the KPI values to analyze individual amounts and get a picture of how the KPI value is broken down. To use the KPI Monitor, select the KPI code and slicing dimension you want to view. In the grid, specify the slice category items to include in the KPI value, select a time frame, and retrieve the KPI value.
The bottom half of the screen displays the result in a chart, by KPI values, or by KPI slice values. The overall value is also displayed at the top of the screen. You can drill down into this graph to view specific KPI elements and their source data, right down to GL transaction level.
KPI Monitor Header displays the KPI Monitor header fields. The example in
KPI Monitor Header is for monitoring Net Profit Margin, which is one of the most important financial KPIs.
Important: You can also analyze the KPIs in the Web UI Action Center.
KPI Monitor Header
KPI Code
Enter an existing KPI code. When you then move focus from this field, the Cube Code, Budget Code, and Formula fields are automatically populated.
Slice By
The Slice By list enables you to select COA dimensions you associated with this KPI in KPI Slice Create. You can only choose one dimension type. The slicing categories in this dimension are then displayed in the grid. To include a category in the KPI value calculation, select the line.
Report Year/Period From/To
Select the range of dates for which you want to calculate the KPI value.
By Period
Select this field to calculate the value by period rather than calculating one KPI value for the total range.
Budget
Where a KPI is designed to be measured against a budget, select this field.
Measure
There are five measures when the Budget field is selected; Actual, Actual - Budget, Actual - Forecast, Budget, Forecast. However, when budget is not selected, you can only choose Actual. When budget is selected and you have already clicked the Get Values button, you can still update the displayed chart by changing the selection on this list.
When you click the Get Values button, the KPI values are displayed in the results pane, as shown in
KPI Monitor Results Pane. There are three tabs on the monitor.
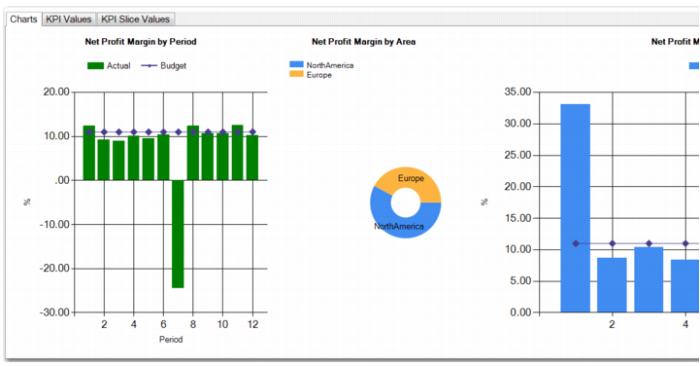
• Charts displays the KPI value in bar graph and pie-chart form. You can roll over the pie-chart representation to see the actual value for each slice.
• KPI Values displays the numbers in grid format. Actuals are displayed along with budget values if you have selected these.
• KPI Slice Values displays the numbers for each slice in grid format.
Note: When you select the By Period field in the header, each tab displays the results by slice for each period.
KPI Monitor Results Pane
In addition to the three representations in the results pane, the overall result is also displayed in bar chart format in the header. When you right-click the chart and click Drill Down, a new window opens where you can drill down into the results for each element. When you drill down from the top chart, the resulting window displays results for the complete period of the KPI, regardless of whether you generated the KPI value by period.
You can drill down into the details by period or slicing category in the results pane. Right-click the period or the slicing category and click Drill Down. The KPI Drill Down opens, and displays the KPI source amounts only for the period or slicing category you select.
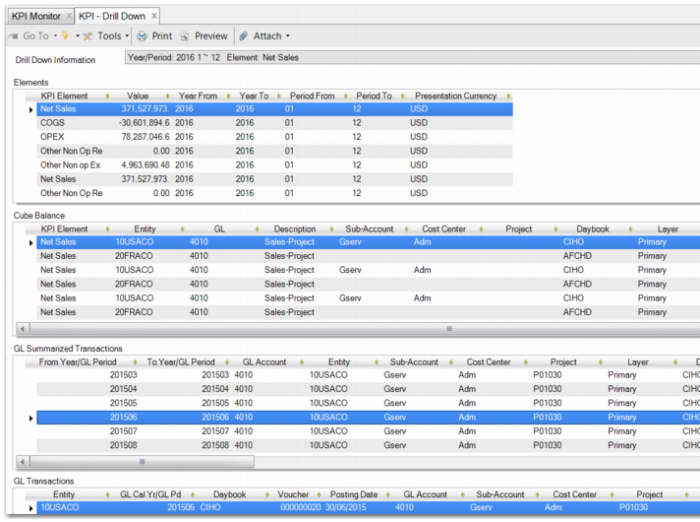
KPI Drill Down
The Drill Down Information field at the top of the KPI Drill Down window displays the period covered by the KPI.
The first drill down displays the KPI elements that compose the KPI formula, as displayed in
KPI Drill Down. When you double-click an element to drill down further, the Cube Balance panel is populated. The Cube Balance panel displays the consolidated data of the KPI.
You can view a summary of the GL transactions that make up a cube balance by double-clicking a line. The GL Summarized Transactions drill down displays the summarized transactions that make up the cube balance amount.
You can drill down still further to individual GL transaction level in the GL Transactions drill down. When you double-click a specific transaction in this pane, Journal Entry View (25.13.1.3) opens and you can review the journal entries for the GL transaction.