MSW Display Preferences
Use the Display tab of the Settings window to define the increment by which MSW calculates totals. Select Option, Preferences, then the Display Tab.
MSW, Display Preferences
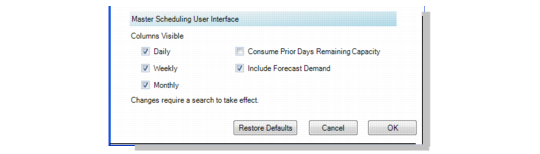
Columns Visible
Specify Daily, Weekly, or Monthly as the increment by which scheduling totals are displayed in the Schedule Grid. When you enter a value, the totals in the Supply/Demand Panel, Capacity Panel, and Schedule Grid display by the increment you enter. You still view data by daily increments in the Schedule Grid. When you select weekly or monthly, you must expand those increments to access the daily display. MSW uses the calendar definition of a month and the GL calendar period for the week.
Consume Prior Remaining Capacity
For information on the Consume Prior Remaining Capacity field, refer to
MSW Consume Prior Remaining Capacity.
Include Forecast Demand
Specify Yes to include the forecast demand in the Demand row in the MSW Supply/Demand Data grid as part of the POH calculation. When you enable this option, you do not have to refresh your screen with a new search to see the forecast demand in the Suppy/Demand Panel. You can click on the Demand field in the Supply/Demand Panel to see the forecast demand and to have it automatically included in the Demand field.
For forecast demand, the system displays the net balance of current forecast demand from QAD EE for the selected item. Master production scheduling and MRP use the net forecast and sales order demand to calculate total demand. The net forecast is calculated as follows:
Net Forecast = Forecast – Sales Order Demand
Note: When the shipment forecast is oversold—that is, the quantity sold exceeds the forecast amount—the net forecast will not go below zero.
Past due is not calculated.
MSW Consume Prior Remaining Capacity
You can specify whether capacity is consumed by future required capacity or not by setting the Consume Prior Remaining Capacity field in the Display Window of User Preferences. Color coding extends beyond the firm scheduling horizon for visibility of capacity shortages. When you set the field to Yes, the cell displays with yellow shading when the system uses available capacity from prior days to satisfy the required capacity. It displays with red shading when there is not enough available capacity on or in days prior to the required capacity date.
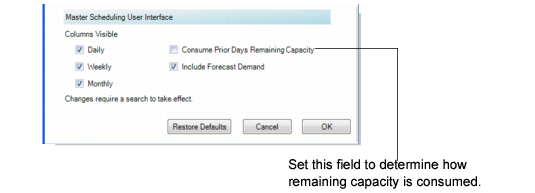
Display Window, Remaining Capacity Setup
Consume Prior Remaining Capacity
Specify whether prior days remaining capacity is consumed by future required capacity.
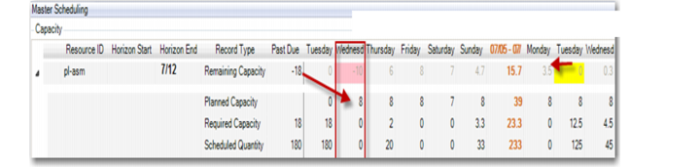
Yes: The prior days remaining capacity is consumed by future required capacity. In
Capacity Example 1, on Tuesday, 7/13, 12.5 hours of capacity are required; however, only 8 hours of capacity are available. When this field is set to Yes, the system looks at remaining capacity before Tuesday to determine whether the Tuesday work can be completed on time. The system finds 8 hours of available capacity on Monday 7/12. So, if the Tuesday work starts on Monday, then 4.5 hours can be used from Monday, and all Tuesday work can be completed on time.
No: The prior days remaining capacity is not consumed by future required capacity.
Capacity Example 1
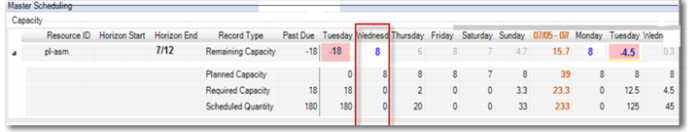
Capacity, Example 2 shows results when the field is set to No. In the figure, the number of remaining capacity hours for Tuesday shows as –18. Tuesday 7/12 displays –4.5 hours remaining and the system did not consume prior remaining capacity available on Monday. The system displays colors beyond the firm scheduling horizon for the capacity frame.
Capacity, Example 2
The remaining capacity row displays a daily delta between the required capacity and planned capacity with no consumption of remaining capacity of prior days. For the daily delta calculation:
• The firm scheduling horizon still excludes planned orders.
• The future horizon includes all open orders.
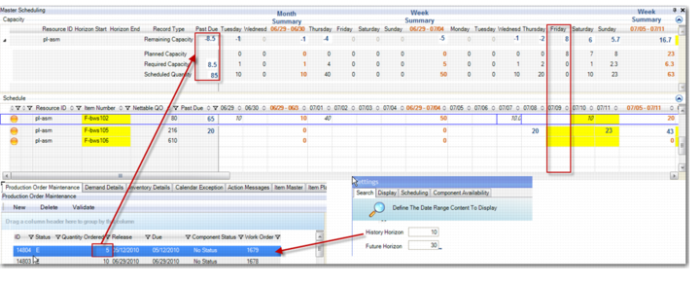
In the following figure, the history horizon was set to 10 days, the future horizon was set to 30 days, and the current date is Friday, 07/09. The past due column totals display past due records; however, the history horizon columns display past due requirements in the Monthly and Weekly Summaries categories. The past due quantity of 5 from 5/12/2010, as shown in the Production Order Maintenance window below the grid, is summarized in the Past Due column. Even though the history horizon is 10 days, the system pulls in all past due supply/demand records.
History Horizon, Daily Net Calculations