Identifying Events
To view the execution flow in full detail, use the system logging functions. Set Debug Level (36.24.3.5) lets you set the level of detail displayed in the system ctlog file. You can display full business code, including parameter values and database queries.
When logging is enabled, you can run the function you want to customize, and then display the execution flow in ctlog. The log displays the business methods used in the function and how they are implemented.
The following business logic flows illustrate the call stack of some of the most used business functions.
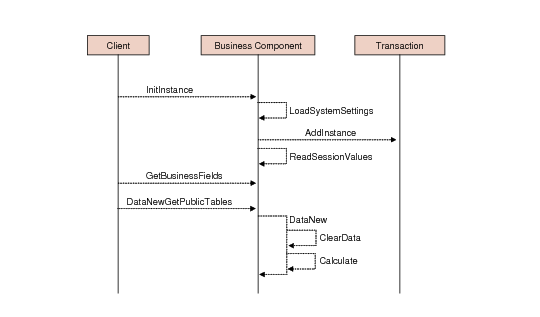
Instantiate a Maintenance Form in Create Mode
Create Call Stack
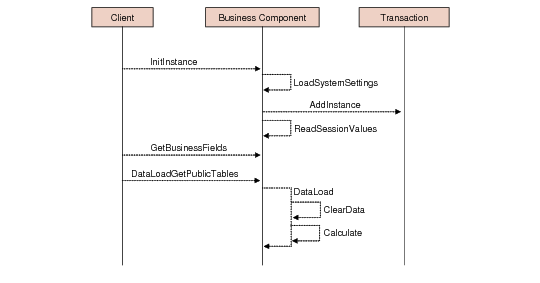
Instantiate a Maintenance Form in Update mode
Update Call Stack
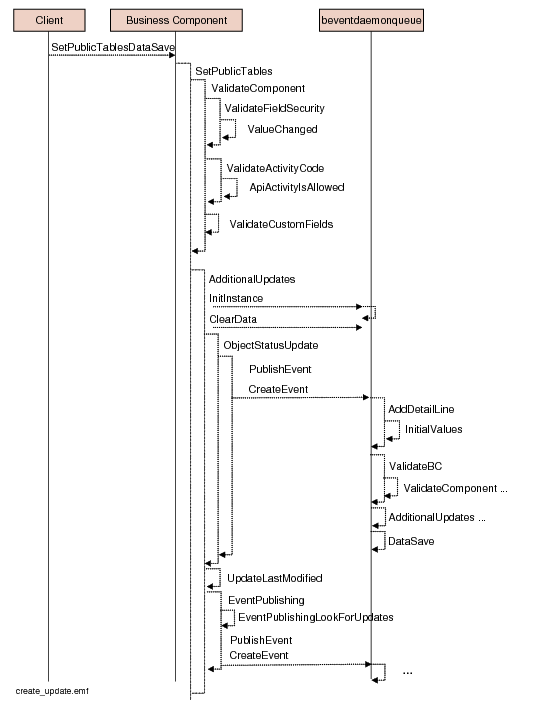
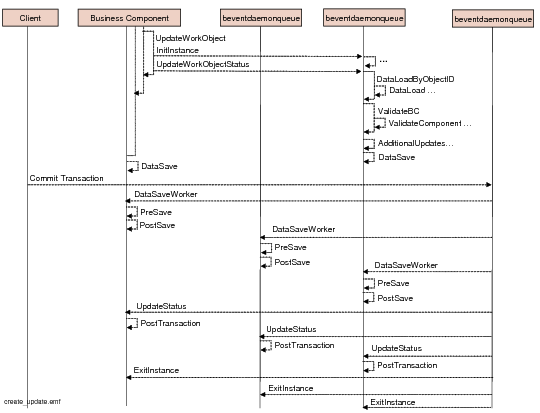
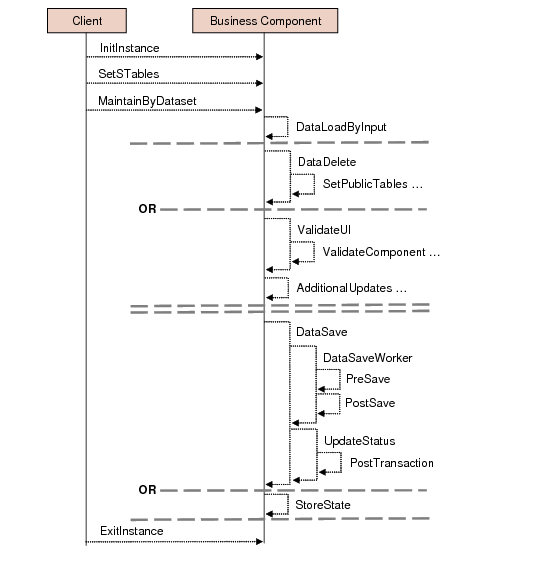
Save Data in a Maintenance Form (Create and Update)
The following diagrams illustrate the call stack for saving data in a maintenance form.
Save Call Stack
Save Call Stack (contd.)
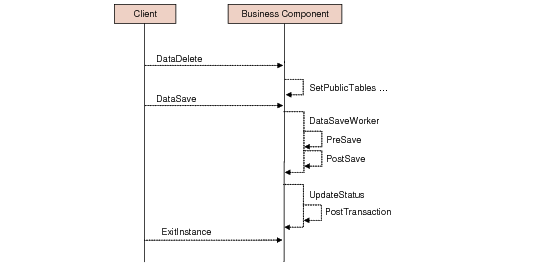
Deleting an Object in a Maintenance Form
Delete Call Stack
Importing Data using the XML Daemon
Import Using XML Call Stack