System Monitor
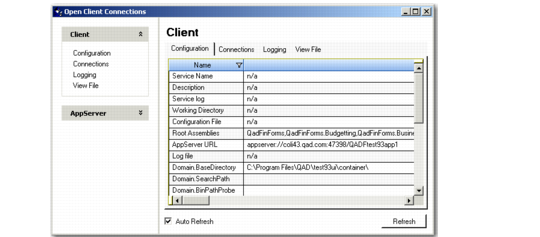
Use the System Monitor function to view information about the application. Two sets of information can be viewed: client settings and application server settings. Click on the various tabs to see additional details.
Use this information to monitor activity and help in troubleshooting.
System Monitor, Client Settings (36.24.3.4)
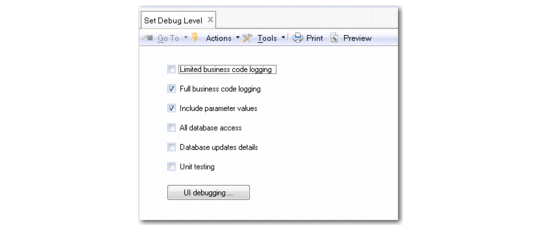
Set Debug Level
The Set Debug Level (36.24.3.5) option lets you set the level of detail displayed in the ctlog file. You can display full business code, including parameter values and database queries. You can use the ctlog file to run a full trace on component methods and procedures.
Note: To run the system log, you must first close all other application screens.
When logging is enabled, you can run the function you want to customize, and then display the execution flow in ctlog. The log displays the business methods used in the function and how they are implemented.
The path and filename for the ctlog file are set in the server.xml file and you can view the filename in the Business Logging entry of the Appserver section of System Monitor (36.24.3.4).
Set the debug parameters and select Save to enable the logging.
Set Debugging Level
Field Descriptions
Limited Business Code Logging
Select this field to log the start and end of all entry-level business methods. Entry-level methods are called from outside the business logic.
Full Business Code Logging
Select this field to log the start and end of all methods and procedures, internal and external.
When Full Business Code Logging is enabled, the CT Logfile also traces the execution of customized code.
Include Parameter Values
Select this field to include parameter values. This field is only available when you select Limited or Full Business Code Logging.
All Database Access
Select this field to include all read or update database queries. The read access logs the executed query statement and the number of records read. The update access logs the action and the rowid of updated records.
Database Update Details
Select this field to include details of all database updates (create, modify, or delete). The log entry contains the complete updated record.
Unit Testing
Select this field to log possible memory leaks. This logging checks for:
• Instances that have not been deleted
• Programs that have multiple instances running persistently
• Dynamic objects (datasets + temp-tables + queries + buffers) that have not been deleted
• Connected appservers
• Connected sockets
This logging also lists all persistent procedures and a total count of all database read access events.
UI Debugging
Click to display the View Performance Results screen and enable UI debugging.
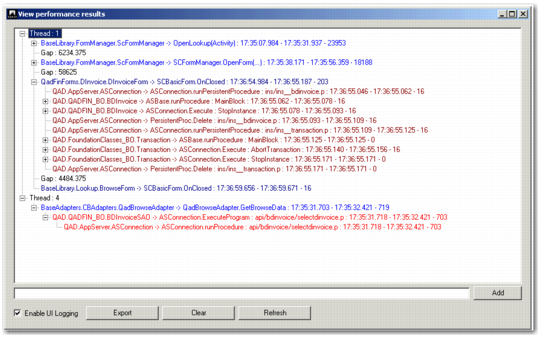
UI Debugging
The UI debugging option lets you log UI methods and procedures. Select the Enable UI Logging field to begin logging, and click Refresh to view UI activity. Click Export to export the currently displayed information to a text file for analysis.
Server-side calls are indicated in red, and UI calls are indicated in blue. Darker red and blue lines indicate calls that take longer than 500 milliseconds. Each running thread is represented by a node in the tree view, and every browse or lookup activated creates a new node. You can add user comments (displayed in orange) to the log.
The Export button allow you to export the log details to a text file
Note: UI debugging is activated in system memory, and for performance reasons, you should not enable the option permanently. Enable UI debugging for specific UI activities, export the thread for analysis, and then disable the option.
View Performance Results