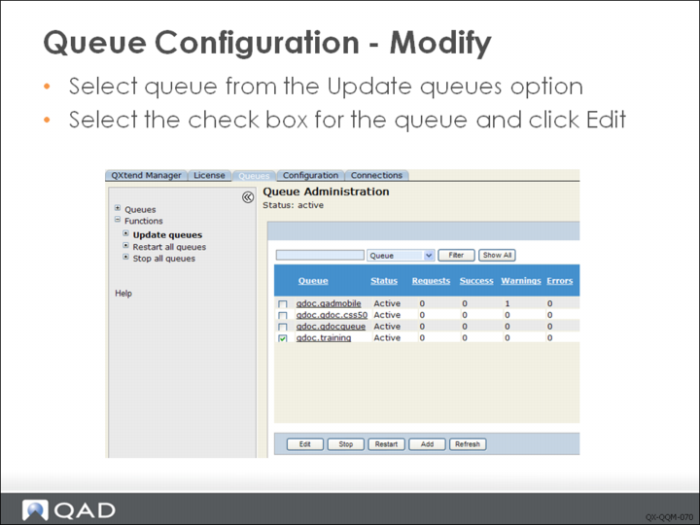
Modifying a Queue
You can edit the queue configuration any time: navigate to the Update queues node on the tree menu, select the queue to update from the list, then click Edit. The Edit Configuration screen displays with the current queue configuration. Modify queue settings as required.
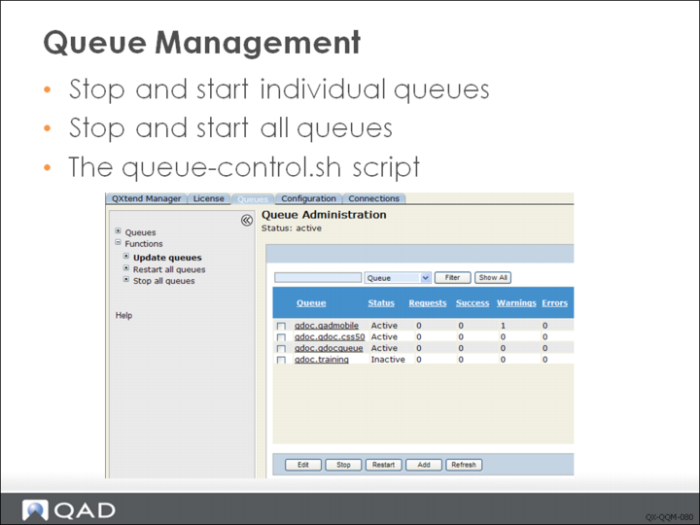
Queue Management
The Queue Manager is responsible for processing messages and monitoring queues for messages that require processing. The list of queues displayed in the Update queues node in the tree menu shows the status of the current queue: Active or Inactive. Inactive queues have been stopped and are not processing messages delivered to the queue. To stop or start queues, select the check box next to the queue and click Stop or Restart as required.
To stop or start all queues, use the Stop all queues and Restart all queues options on the tree menu.
You can also use the queue-control.sh script to start, stop and restart queues, as well as query the connection pool status. This script can be found under WEB-INF/scripts directory of QXI web application..
Queue Monitoring
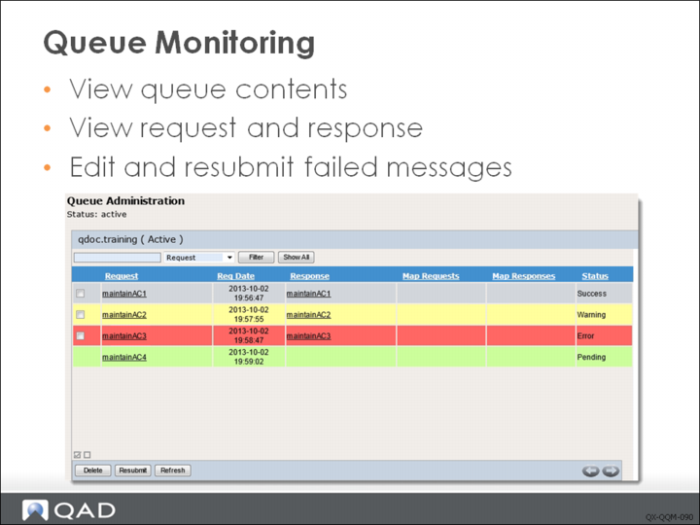
You can monitor the queues managed by the Queue Manager by using the Queues tab in QXI. Select the Queues node in the tree menu to display all queues currently being monitored by the Queue Manager. Select the queue you want to monitor from the list of queues displayed.
When you choose a queue name on the tree menu—or select a queue from Functions|Update Queues—the contents of the queue displays. The queue document list is color coded:
• Red lines are documents that returned an error.
• Yellow lines are messages that processed but a warning was returned.
• Green lines are messages that are either pending or in process.
• Grey lines are successfully processed message.
By default, the display shows 100 records. Use the scrollbar on the queue to view all 100 documents. You also can set the number of documents to display by entering a value in the Records field, and specify the message to start from by using the Start From field.
Sorting
You can sort a queue by clicking the sort column name. Click once to sort in ascending order. Click again to sort in descending order.
Filtering
You can filter the queue by entering criteria text in the field above the table. Then select the document type from the drop-down list. Choose Filter to select the queues that include the text and document type. The filtered result is case sensitive.
Example: Enter test and select Warnings. Then choose Filter. This displays a list of warnings present in all queues that contain the character string test in the name. Click Show All to display all queues again.
Note: To maintain optimal performance, filter and sort options do not refresh the data—they filter data already displayed. To refresh the data with changes to the server, click Refresh before sorting or filtering.
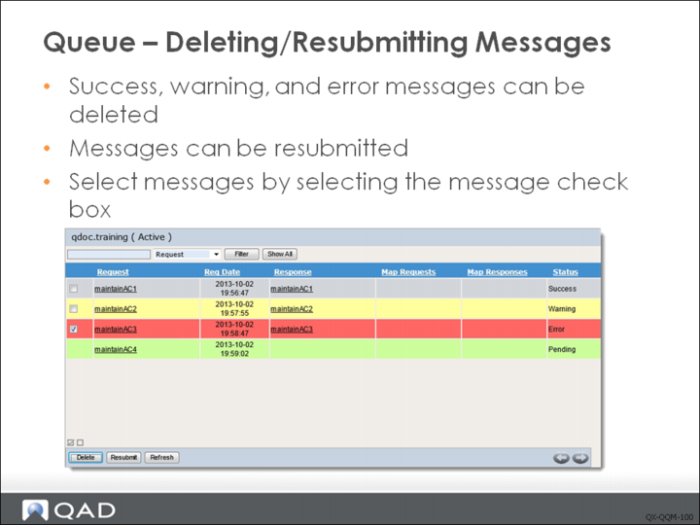
Deleting Messages
Messages processed by the Queue Manager are not purged automatically—you can delete messages from the Queue Manager. Select the queue you want to manage, select the messages you want to delete from the system by selecting the check box next to the messages in the queue, then click Delete. Only messages with a Success, Warning, or Error status can be deleted.
Note: If you intend to process a high volume of messages through any of the queues managed by the Queue Manager, you should set up an automated clean-up routine to delete old messages. If old messages are not deleted regularly, the response directory becomes too large and is then difficult to work with; in addition, the queue might contain thousands of messages, making it difficult to find and manage messages.
You can select and resubmit failed QDocs directly using the Resubmit button in Queue Administration. You can also first edit a failed QDoc to correct any errors in the document and then resubmit it in the Edit QDoc Request screen, which will be introduced later.
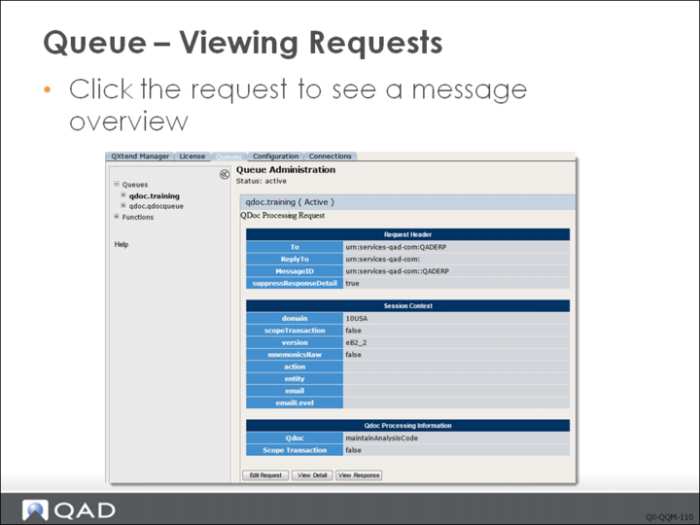
Viewing Requests/Responses
You can drill into any request in the current queue being monitored to view the request contents. To view a request, click the name of the request message in the queue. The name in the request column is a link that displays the message overview screen. From the message overview screen you can view the detail (actual XML) of the request and to drill into the Response message overview screen.
If the response message has an Error status, you can edit the request and resubmit it.
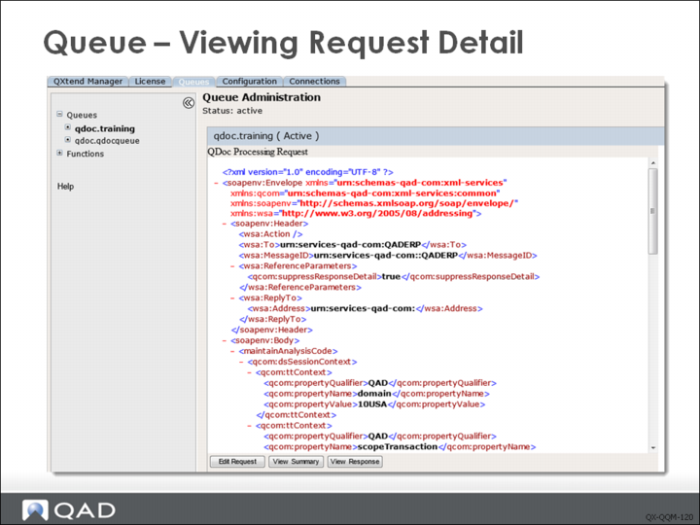
Viewing Request Details
From the request overview screen you can click View Detail to display the actual XML message that was submitted to the Queue, and subsequently to the QXI Web service. From this screen you can switch back to the detail view or drill into the Response overview screen.
If the response message has an Error status, you can edit the request and resubmit it.
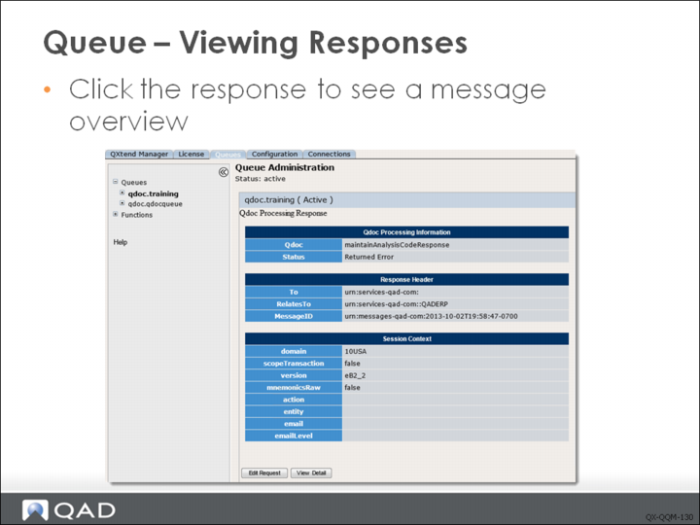
Viewing Responses
You can drill into any response in the queue currently being monitored to view the response contents
To view a response, click the name of the response message in the queue. The name in the response column is a link that displays the message overview screen. From the message overview screen you can view the detail (actual XML) of the response.
If the response message has an Error status, you can edit the request and resubmit it.