QAD QXtend Outbound Logging
There are three main areas where logging takes place in QXtend Outbound:
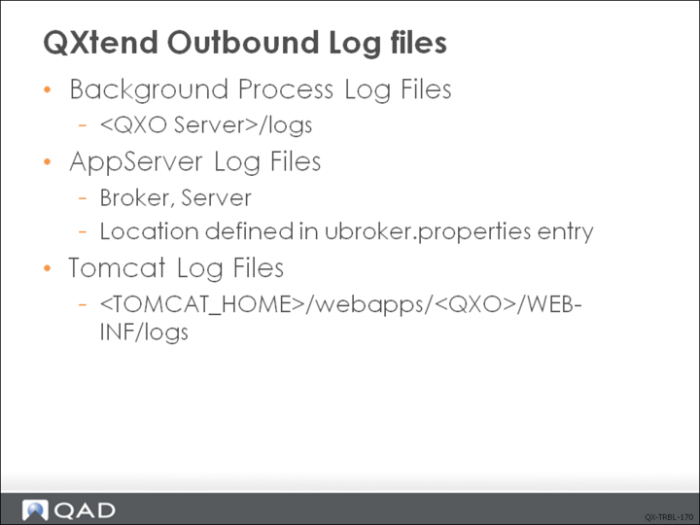
• Session log files: the session log files are the log files for the background Progress sessions for the Event Service, Message Publisher, Message Sender and Archive Service.
• AppServer log files: the AppServer is used mainly for the communication between the QXO Administration UI (Tomcat/java side) and the QXO DB (OpenEdge side). The AppServer may also be used when implementing calculated fields.
• Tomcat log files: Tomcat is used for housing the QXO Admin UI. As such the log file called outbound-ui.log in <TOMCAT_HOME>/webapps/<QXO>/WEB-INF/logs only logs information related to the UI. No QXO processing information is logged to the Tomcat logs.
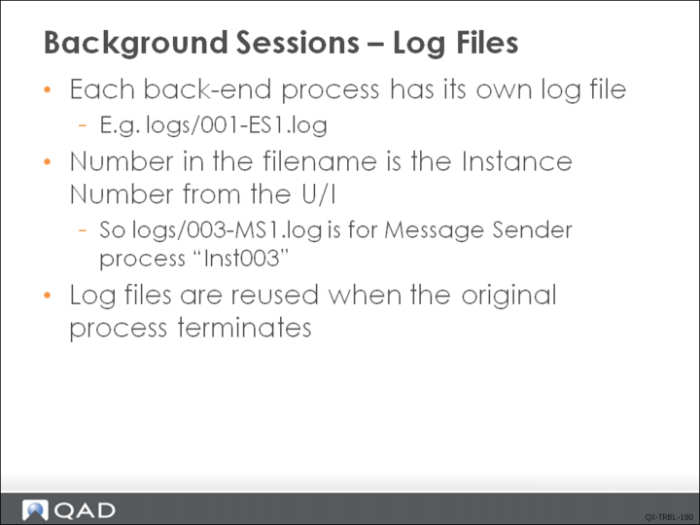
Background Sessions - Log Files
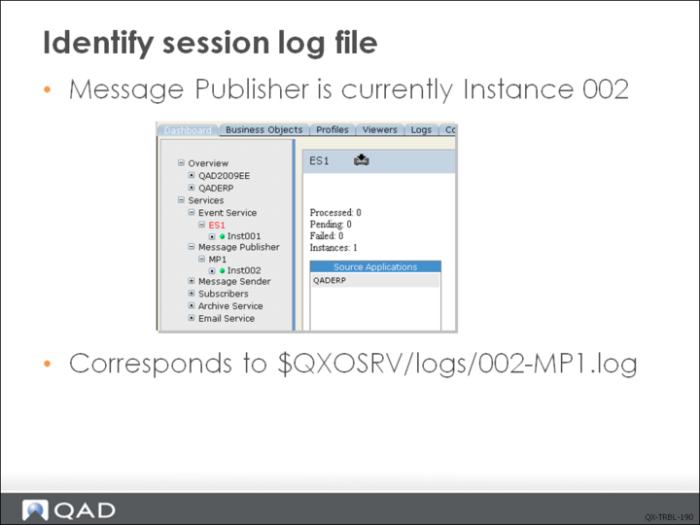
Identify Session Log File
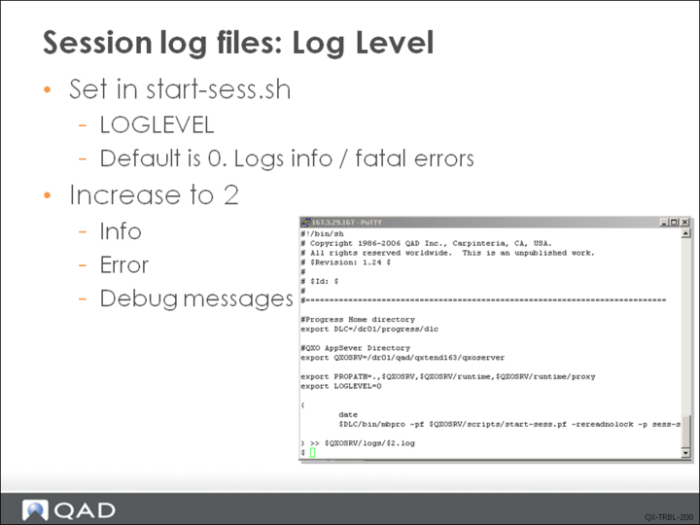
Session Log Files: Log Level
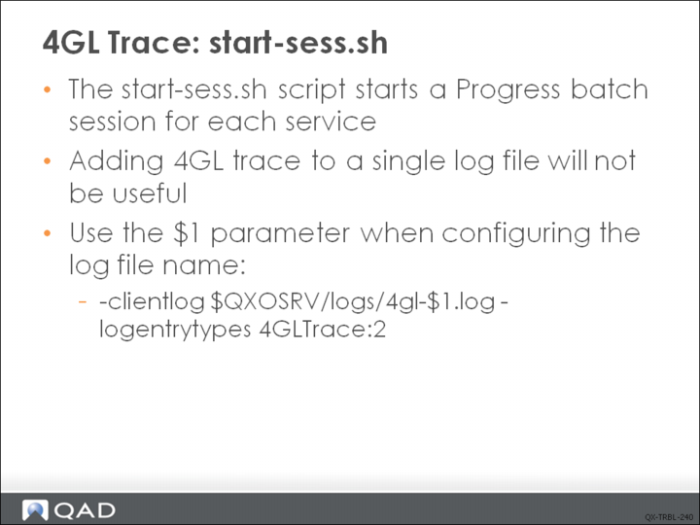
This start-sess.sh can be found under $QXOSRV/scripts directory.
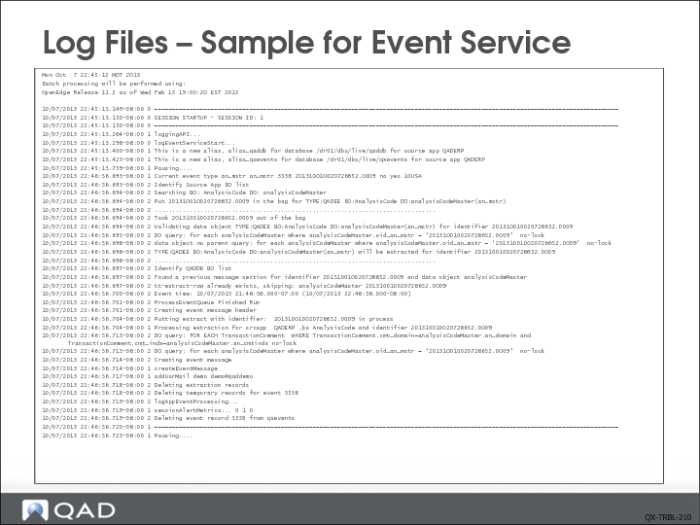
Log Files - Sample for Event Service
This is a sample of the Event Service log file with the logging level increased to 2. The start of the log file shows the session id of the event service. This allows to trace it back to the service instance in the QXO UI. This log file is useful when debugging message extraction problems. When running in debug mode the identifier of the event message is displayed and also the query used on the object including any filter data specified on the Business Object definition.
It is worth noting that this log file is only used for extraction type event message and not for events messages that are created using the Direct Data Publish API.
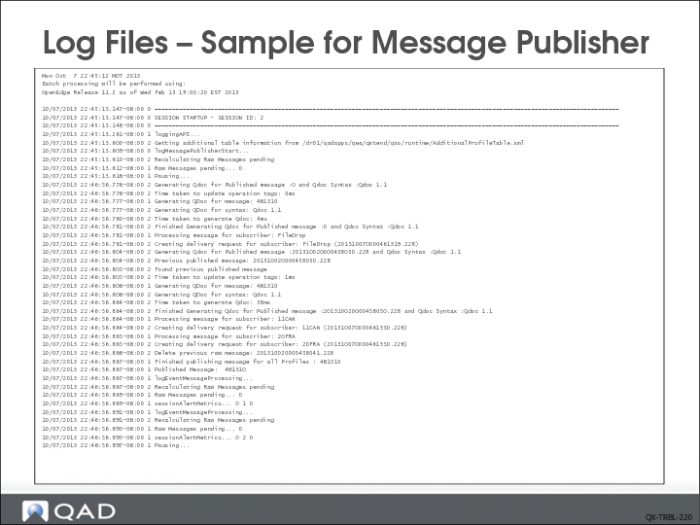
Log Files - Sample for Message Publisher
This is a sample of the Message Publisher log file with the logging level increased to 2. The start of the log file shows the session ID of the event service. This allows to trace it back to the service instance in the QXO UI. The Message Publisher is responsible for creating the QDoc profile message, and this log file is useful when debugging the creation of profile messages and delivery requests for each profile message. When running in debug mode, the time taken to create the profile message is logged, along with the name of the profile and any registered subscribers.
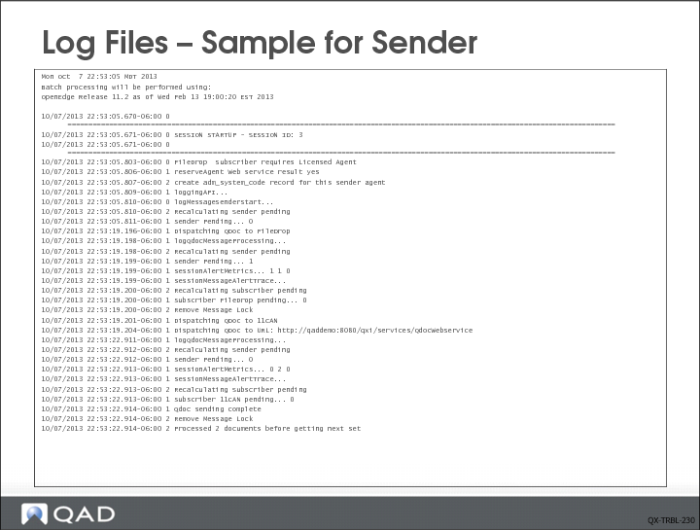
Log Files - Sample for Sender
This is a sample of the Message Sender log file with the logging level increased to 2. The start of the log file shows the session id of the event service. This allows to trace it back to the service instance in the QXO UI. The Message Sender is responsible for delivering messages to all registered subscribers. This log file is useful when debugging message delivery problems.
4GL Trace: start-sess.sh
In addition to the LOGLEVEL setting in the start-sess.sh script, you can enable the 4GL Trace logging for each of the background services. You will need to use the $1 parameter to separate the trace log files for each of the services. You can add the -debugalert option of the logging command to ensure you capture any Progress errors should a session die abruptly.
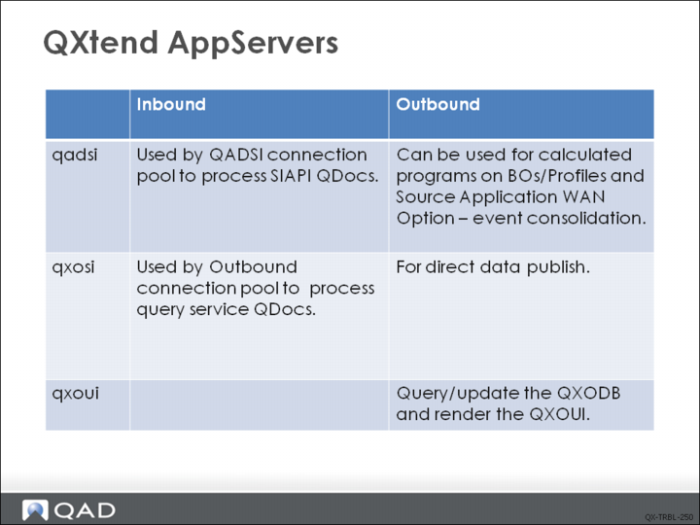
QXtend AppServers
There are three AppServers created during QXtend installation and each has specific responsibilities.
• qadsi (QAD Service Interface) AppServer connects with enterprise application databases and event database. It is mainly used by QADSI Connection Pool to process SIAPI QDocs. It can also be used by Outbound as the server to run calculated programs on BOs/Profiles and the server to run event consolidation, when source application WAN option is set to true.
• qxosi (QXO Service Interface) AppServer connects with qxodb database. It also dynamically connects to source application databases (using the parameters defined in source application) to query data. This AppServer is mainly used in two areas, direct data publish and query service.
• qxoui AppServer only connects with qxodb database. It is called by Outbound UI to query/update the qxodb and render the Outbound UI.
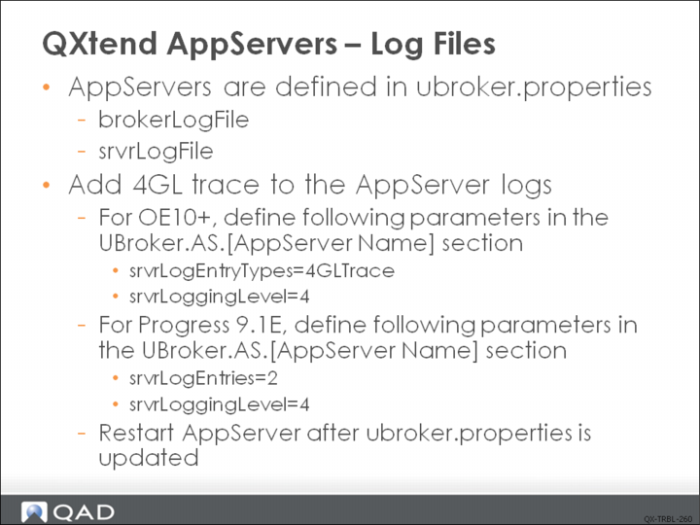
All the above AppServers are configured in the ubroker.properties of the installed Progress base.
Check the relevant sections of the AppServer for the location of the AppServer broker and server logs. For example:
brokerLogFile=/dr01/logs/progress/qadsi_ASlive.broker.log
srvrLogFile=/dr01/logs/progress/qadsi_ASlive.server.log
In order to add 4GL trace to the AppServer logs, specific parameters need to be defined in UBroker.AS.[AppServer Name] section in ubroker.properties.
• For OE10+, add:
srvrLogEntryTypes=4GLTrace
srvrLoggingLevel=4
• For Progress 9.1E, add:
srvrLogEntries=2
srvrLoggingLevel=4
AppServer must be restarted before the new parameters take effect.
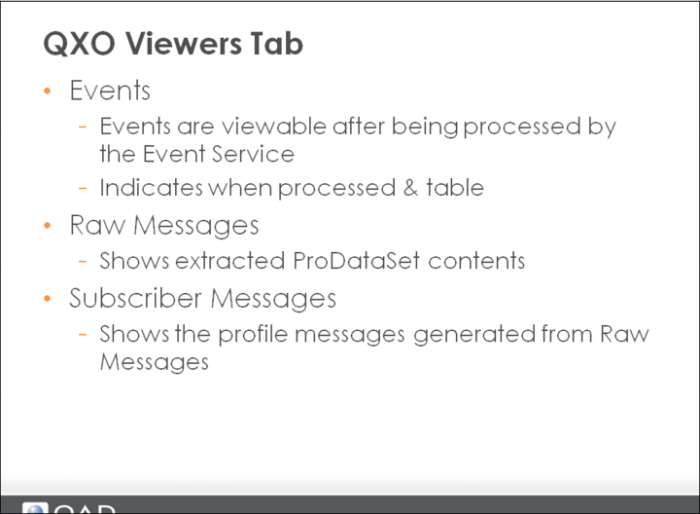
QXO Viewer Tab
On the Events tab the information available includes the event service instance name, the time stamp of the event record, the source application name, the source domain of the event, event type name, event id and status. You will not see any Direct Data Publish event details as these message use a different API.
The Raw Message tab includes the source application name, source domain, event message identifier (rowid, OID, GUID), event type detail, business object extracted, the time stamp of the raw message record, message id and status. Clicking an entry displays the business object event message XML data. This is the data before any associated profile definition is applied to the message.
The Subscriber Messages tab shows entries for the profile name, source application, the time stamp of the subscriber message record, the target subscriber, delivery status, number of failures, and identifier of the subscribe message. Here, you can click an entry and view the request XML (this is the XML message that is sent to the subscriber). You can view the response XML by clicking the View Response button at the bottom of the XML. The response XML contains the response details (if any) returned from the subscribing application.