QXtend Message Monitor
Message Monitor is a .NETUI browse installed by QXtend that allows you to view subscriber messages and all related information in QXtend Outbound.
Profile messages are generated by QXO and delivered to external subscribers. The QXtend Message Monitor allows you to track these outbound profile messages, as well as the response messages that are returned from subscribers. You can view the complete lifecycle of profile messages through QXtend—from publication and delivery through to response.
A profile message is created for each profile that is registered against a business object. Response messages are generated by the destination application and returned to QXtend Outbound.
You can use the QXtend Message Monitor to view:
• A summary of profile messages delivered to subscribers
• Details of subscriber messages, including delivery status
• Details of subscriber responses arising from message processing
• Raw XML data for messages, requests, and responses
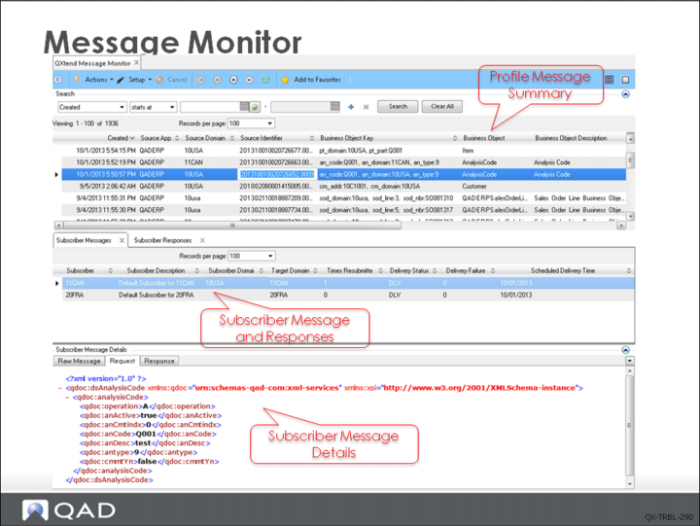
The profile message summary, located at the top of the QXtend Message Monitor screen, describes profile messages that have been delivered to subscribers. Clicking a profile message causes the associated subscriber messages and subscriber responses to display in the relevant tabs.
A single profile message may have one or multiple related subscriber messages. If a subscriber message is delivered successfully on first submission, only one subscriber response exists for that message. If delivery is unsuccessful, a message may have multiple subscriber responses describing the processing errors.
• Subscriber Messages Tab: The Subscriber Messages tab shows response messages received from the subscriber. You can resubmit or delete requests here.
• Subscriber Responses Tab: The Subscriber Responses tab shows message responses returned from the subscriber. A message that is delivered successfully will have only one response. A message that has resubmitted can have potentially multiple subscriber responses indicating why delivery failed. You can expand subscriber responses for messages that have multiple errors.
Subscriber message details display XML code representation of the raw message event, subscriber message, or subscriber response.
Exercise: QAD QXtend Diagnostics and Troubleshooting
The following list shows a number of key concepts used in QAD QXtend logging and tools. In each statement below, fill in the correct term from the list.
error | connectionPools.log |
session log | Info |
qdocResponses.log | QAD QXtend Outbound |
qxtendserver.log | Queue Manager |
qdocInstall.log | qdocRequests.log |
midnight | |
1 Each QDoc request that is received by the QAD QXtend Server is logged in the ______ file.
2 Each QDoc response that is returned by the QAD QXtend Server is logged in the ______ file.
3 These log files are set so that each day at ______ the log file rolls over and archives the existing log file with a date suffix and starts a brand new log file.
4 The ______ file logs details about the startup and shutdown of the Environment Manager and all of its managers.
5 All activity with the connection pools is logged in the ______ file; the date, time, and other information is recorded.
6 All processing that is internal to the QAD QXtend Server is logged in the ______ file. To ensure the size of this file does not rapidly become too large, you should set the logging level to ______ unless otherwise instructed.
7 The ______ log file contains the details of the queue processing. The default setting for the logging level of the queue is ______.
8 You can use the 4GL Trace start-sess.sh script to help you troubleshoot log files in ______.
9 The ______ files are the log files for the background Progress sessions for the Event Service, Message Publisher, Message Sender and Archive Service
Lab: Troubleshooting
QAD QXtend 1.8.4 has been installed with both QXI and QXO components. In the previous labs you performed the basic configuration that is required to enable requests to be processed by QXI and QXO. In the following lab exercises you will see how logging is used in QAD QXtend to aid in diagnosing and troubleshooting.
<LabHomeDirectory> = C:\QXtendTraining\Labs\11-Troubleshooting\
Logging in QAD QXtend is enabled by default. The logging in QXI is mostly on the Java side. The QXO logging is mostly on the Progress side, remembering that the UI for QXO is housed in Tomcat and does not affect the day-to-day processing in the QXO services.
The exercises in this lab will walk you through enabling the debug log levels and monitoring the log files in QAD QXtend.
1. QAD QXtend Inbound Logging
The logging in QXI uses the log4j framework. The log files generated by QXI are written to the <tomcat-home>/webapps/<qxi-webapp>/WEB-INF/logs directory. Logging in QXI occurs by default. However, only information and error messages are logged by default.
To enable debug messages to be output to the log files a configuration file needs to be edited. Follow these steps to enable debug logging in QAD QXtend Inbound:
1 Open PUTTY use the icon on the training Windows machine Desktop.
2 Double-click the qaddemo saved session.
3 Log in as user demo-admin, password qad.
4 Change directory to /dr01/tomcat/8080/webapps/qxi/WEB-INF/conf.
5 Edit the qxtendlogging.xml file.
a vi qxtendlogging.xml.
b Change the text below from:
<logger name="com.qad" additivity="false">
<level value="error"/>
<appender-ref ref="qxtend.debug"/>
</logger>
to:
<logger name="com.qad" additivity="false">
<level value="debug"/>
<appender-ref ref="qxtend.debug"/>
</logger>
c By setting the level to debug, debug messages will start being logged to the qxtendserver.log file.
6 Save your changes to this file
1.1 Monitoring QAD QXtend Inbound Log Files
The changes that you made in the previous step will take effect after restarting the QXI Web application. The QXI logs directory is located at <tomcat-home>/webapps/<qxi-webapp>/WEB-INF/logs.
We need to process some QDoc requests to provide debug messages for analysis. In previous labs you have gained experience processing QDocs. The following steps will take you through processing some requests and then viewing the QAD QXtend Inbound log files:
1 Use one of the requests from the previous labs to process through QXI:
Customer Item Update
2 Navigate to the logs directory
3 Open the WinSCP application that is installed on the Windows image.
4 Open the stored session demo-admin@qaddemo.
5 Navigate to the location of the logs directory:
/dr01/tomcat/8080/webapps/qxi/WEB-INF/logs
6 Open the qxtendserver.log file using WordPad.
7 Search for the string app=ppcpmt.p. This is the start of processing the QDoc. By navigating to this part of the log file you can then step through the processing debug messages as the QDoc is processed through the UI API.
Explanation of each step in the debug log is beyond the scope of this course. However it is a useful step in understanding how to locate the start of the QDoc processing and then being able to see any exception error messages. Explanations of the exception error messages are located in the reference section of User Guide: QAD QXtend.
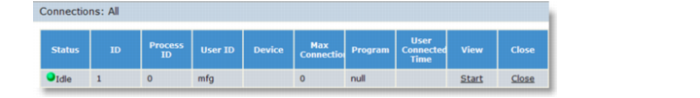
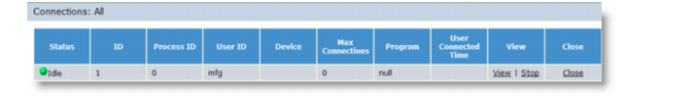
1.2 QAD QXtend Inbound Connections Viewer
The connection pool for UI API connections contains a built-in connection viewer. Using the Start link you can debug your QDocs.
Follow this process to start viewing the telnet connections:
1 Open the QXI page in Internet Explorer: http://qaddemo:8080/qxi
2 Navigate to the QADERP UIAPI Connection Pool.
3 View the current connections in the pool.
4 Click the Start link to start the telnet viewer process:
5 Click Refresh on the Connections viewer page.
6 You should now see a View link for the connection:
7 Click the View link.
8 A new pop-up window will display. This window will be a direct view on the telnet connection.
9 If there is an error in the QDoc, the scrolling of the QDoc on the telnet window halts at the location of the error. When finished testing your connections, choose the Stop link, which displays next to the Start link.
10 Process the QDocs used in the Queue Manager lab through QXtend and view the connections as they go through the screen.
2. QAD QXtend Outbound Logging
The QAD QXtend Outbound services are on the OpenEdge background sessions. Therefore the logging of the services is handled within the OpenEdge code. This is different to the logging in QAD QXtend Inbound which was Java-based. The QXO Server logs directory is located at:
/dr01/qadapps/qea/qxtend/qxo/logs
2.1 Identifying QXO Session logs
The session log files for the Event Service, Message Publisher and Message Sender services are written to the QXO Server logs directory and use the naming convention: <instance number>-<name of service>.log. For example, 001-ES1.log, 002-MP1.log, and so on.
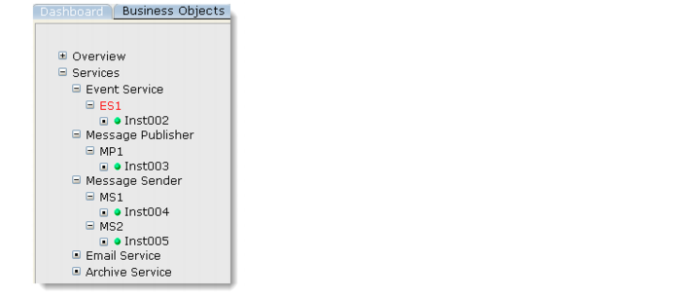
To easily identify which session log corresponds to which service instance, you will need access to the QXO UI to view the sessions that are currently running. Follow this process to identify the service log files in the system:
1 Open the QXI page in Internet Explorer http://qaddemo:8080/qxo.
2 Select the Dashboard tab.
3 Click the Services link. This displays an overview graph of the services currently running in the system.
4 Expand each of the services links:
Each of the Inst002, Inst003 etc have a corresponding session log file in the QXO Server logs directory.
5 Use WinSCP to navigate to the logs directory and identify each of the session log files. The logs directory is located at: /dr01/qadapps/qea/qxtend/qxo/logs.
6 In this directory, there should be log files, such as 001-ES1.log, 002-MP1.log, 003-MS1.log, etc.
7 Open the files and view the level of detail in them.
2.2 Increasing QXO Session Logging Level
The default logging level of the QXO services is 0, which indicates that only Error and Info messages are logged to the session log files. Info messages include details of when services are started and stopped. Error messages occur when processing halts due to a configuration or data error. To increase the logging level, follow this process:
1 Use WinSCP to navigate to the logs directory. Use the demo-admin session that is configured in the WinSCP application.
2 Navigate to the QXO server scripts directory at: /dr01/qadapps/qea/qxtend/qxo/scripts.
3 Open the start-sess.sh script.
4 Notice the LOGLEVEL variable is currently set to 0.
5 Increase the logging level by setting LOGLEVEL=2.
6 Save the changes to the start-sess.sh file.
7 Note that the change to the logging level setting does not take place automatically. The services need to stopped and started for the setting to take place.
8 Navigate to the Services on the QXO UI and click Stop All.
9 Once the services have stopped, click Start All to start the services again.
10 Using WinSCP, navigate to the logs directory at: /dr01/qadapps/qea/qxtend/qxo/logs.
11 Open the session log files and view the extra logging details that are present.
12 Using the Generalized Codes configuration setup in a previous lab (06 Business Objects and Profiles), process some Generalized Codes records. You can do this by logging into QAD EE and creating some Generalized Codes records.
13 View the session log files again using WinSCP navigate to the logs directory at:
/dr01/qadapps/qea/qxtend/qxo/logs
14 Open the session log files and view the extra logging details that are present.