Analysis
This section discusses the following Analysis module topics:
Analysis
Reports, available in the Analysis menu, help decision makers analyze diverse aspects of a business before making strategic decisions. The QAD Enterprise Asset Management system offers multiple default reports. While many of these reports are delivered with the system, you can generate custom reports from the information in the database.
You can choose various output media for reports. You can output the reports to external applications, as well.
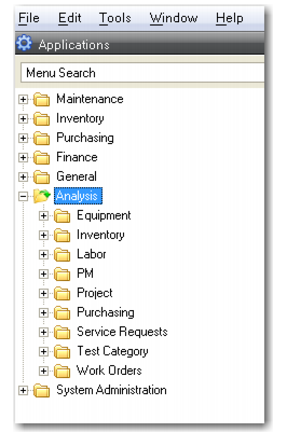
Reports Menu
Running Reports
Open the Analysis folder. Navigate to the module folder, then to the appropriate report folder. Double-click the report link to open the filter criteria window.
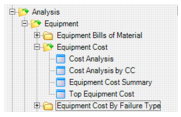
Report Shortcut
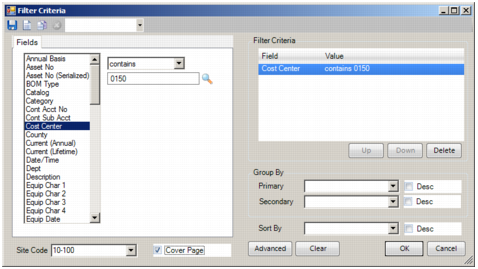
Specify report criteria in the report filter window.
Report Filter Criteria Window
Customizing Report Filters
Each report has a default set of selection fields. You can specify filter criteria for each field; for example, “equipment number starting with 00.”
Specifying Filter Criteria
1 Verify the site in the drop-down on the bottom left.
2 If the filter requires a date range, enter it manually or use the calendar buttons.
3 Select a field.
4 Indicate the search logic. Indicators can include:
equals | is zero |
is not equal to | is not zero |
is at most | contains |
is at least | does not contain |
is more than | is blank |
is less than | is not blank |
5 Use the Up and Down buttons to change the filter priority. Click Delete to remove the criteria from the Filter Criteria list. Fields removed from the Filter Criteria list remain in the database.
6 Indicate Group By criteria for primary and secondary groupings. Select the Desc check box for a descending list.
7 Indicate Sort By criteria. Select the Desc check box for a descending list. The Sort By menu is blank if the report, by definition, is already sorted by a specific parameter. For example, the Work Order Labor Summary by Class does not have any Sort By options because it is predefined to display by class.
8 To alter the Boolean statement manually, click Advanced.
9 Click OK to run the report.
After you specify filter criteria, you can save those settings. Report filters are separate from application filters. They are saved at the user level.
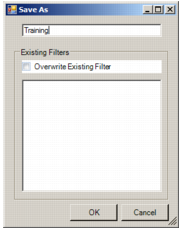
Saving a Report Filter
1 In the Filter Criteria window, select the settings that you want to save.
2 Click the disk icon in the upper left of the Filter Criteria window. The Save As window appears.
Filter Save As Window
1 If it is a new or renamed filter, enter the new name.
2 Click OK.
3 Verify that you want to save the filter.
Note: If you already have a named filter open, the system prompts you to overwrite existing selection criteria.
Overwriting an Existing Filter
1 Select an existing filter.
2 Select the Overwrite Existing Filter check box.
3 Click OK.
Report Output
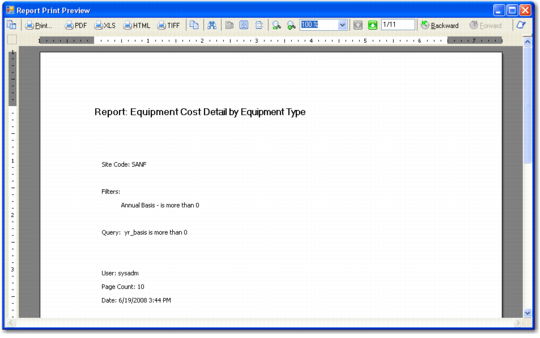
Report data displays in a print preview window. Use the menu bar at the top of the report output screen to make output selections, print, and navigate through the report.
Report Print Output
Report Format
All reports have a standard format:
• Cover page
• Cover page details
• Report pages
Saving Output to File
You can save the report to your computer or network.
1 Click the button labeled with the format to save the file:
• PDF
• XLS (Microsoft Excel)
• HTML
• TIFF
2 Navigate to the location to store the file.
3 Enter a file name.
4 Click Save.
When you display a report, you can choose the output format, change the page setup, define print options, and close the report using the toolbar or the File menu.
Report menu bar
.

Report Menu Option | Purpose |
Table of Contents | Each page in the report has an entry in the table of contents. Click the entry to directly open a page. |
Print | Send the report to a network or local printer. |
PDF | Save the report in pdf format. |
XLS | Save the report in Excel format. |
HTML | Save the report in HTML format. |
TIFF | Save the report in TIFF image format. |
Copy to clipboard | Select items in the report and copy them to the clipboard to use in other applications such as Word or Excel. |
Find | Search for specific text or numbers. |
Single Page View | View one page at a time. |
Multi Page View | View up to six consecutive report pages at a time. |
Continuous scroll | Scroll through the report without clicking page up and down buttons. |
Zoom in | Enlarge the display. |
Zoom out | Shrink the display. |
Adjust view percentage | Indicate a specific percentage for the display view. |
Page down | View the next page of the report. |
Page up | View the prior page of the report. |
Page X of Y | Navigate to a specific page in the report or verify which page you are currently viewing. |
Backward | Navigate through consecutive views you have taken of the report. These may not be consecutive pages, depending on how you originally navigated. |
Forward | Return through consecutive views you have taken of the report after navigating backward. These may not be consecutive pages, depending on how you originally navigated. |
Annotations | Add annotations to a report. |