MSW Process
There are many different ways to access resource and scheduling data within MSW, and many different functions that you can perform using the data for a master schedule. The graphic above depicts a typical process for most schedulers.
Scheduling Horizon Section
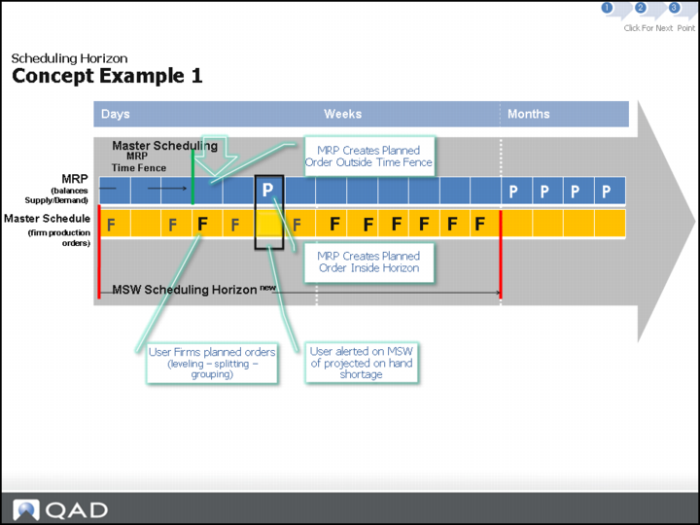
Concept Example 1
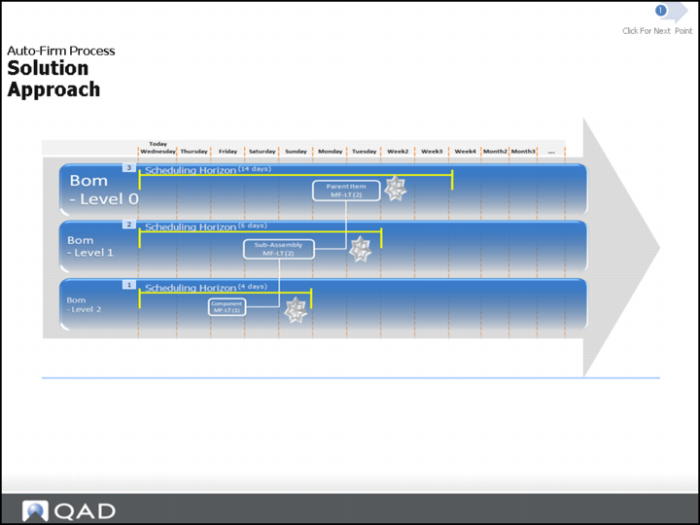
MSW gives you user-configurable control over where the MPS schedule horizon ends and where the future window begins. MSW calculates data differently in the scheduling horizon display than in the future window. Within the scheduling horizon, the system shows the period in which MSW applies the item visual indicators. In the horizon, days are calendar days, not working days.
MRP shows the planned orders within the scheduling horizon; it is up to you as the scheduler to firm those orders.
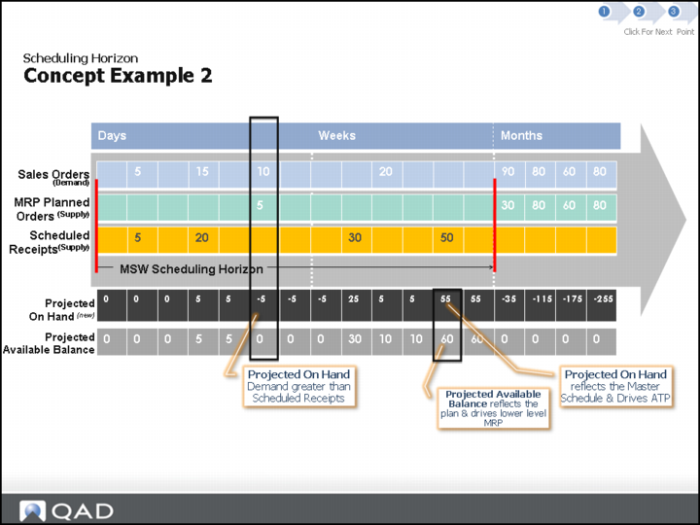
Concept Example 2
In the MSW, you can identify resources and items that require scheduling intervention. You can locate resources that have items with negative POH for every item with supply/demand within the scheduling horizon. The system reveals a visual indicator showing that one or more items on the resource have POH issues.
Also, you can make updates to existing quantities in the MSW, the system performs POH, required capacity, and other calculations and displays changes.
Important: MSW displays balance based on what you the scheduler have scheduled, while MRP shows what is planned and scheduled for the balance.
ATP data is based on only firm scheduled orders.
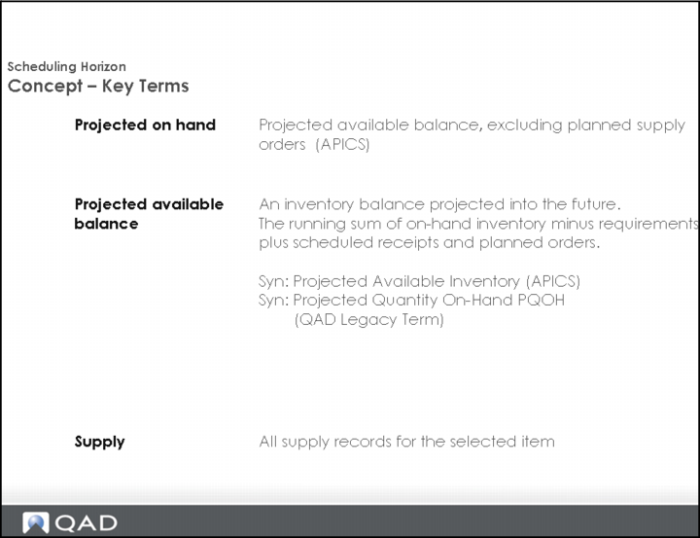
Concept: Key Terms
Note the difference of Projected on hand not including planned orders, but projected available balance does include planned orders.
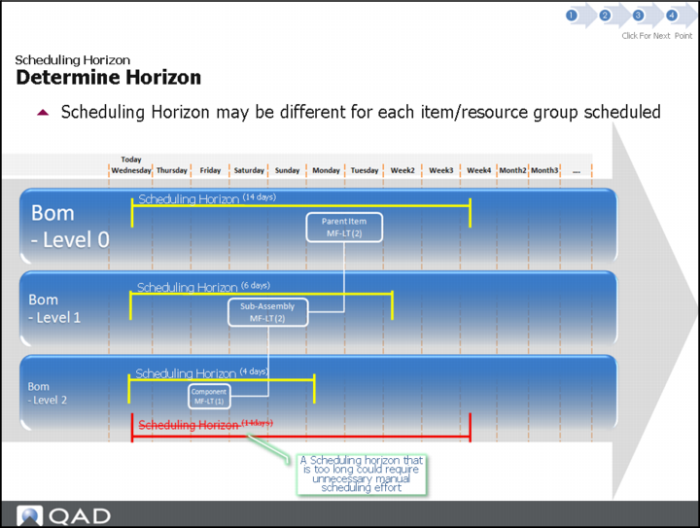
Determine Horizon
You can change the schedule horizon dynamically through the Preferences pull-down menu. You select Options, then Preferences, then Search to set the future and history horizon.
A long scheduling horizon can cause unnecessary scheduling effort, so keep your scheduling horizon short enough for you to easily manage the schedule.
Setup
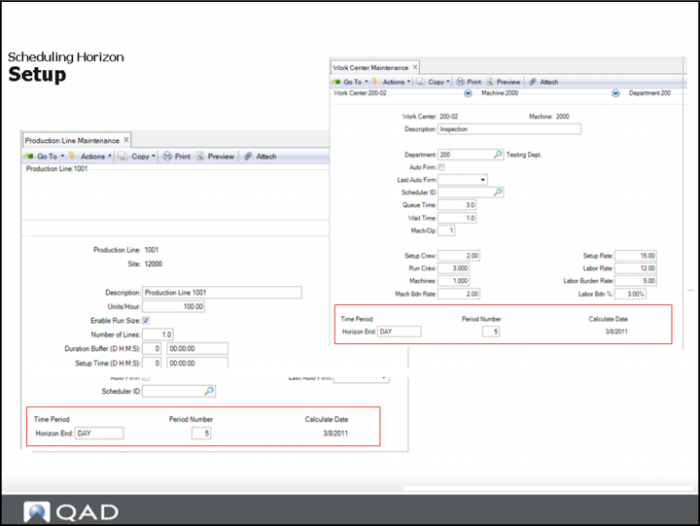
Fields in Work Center Maintenance (14.5) and duplicated in Production Line Maintenance (18.1.1) control the schedule horizon end and the number of periods within the schedule horizon.
Specifically, you set the Horizon End field to either Day, Week, or Month, then set the number of periods for the increment in those programs. The system displays a read-only calculate date. The system calculates the date from period and period number, so if you set Horizon End to Day and Period to 5, the Calculate Date is five days starting with today. If you set Horizon End to Week and Period to 4, then the Calculate Date is four weeks from now including today.
Note: The Preferences settings control how far out in time you can view dates on the Schedule Grid.
Future Horizon Versus Scheduling Horizon
The following topic describes the field.
Future Horizon
Enter the number of days that constitute your future horizon. For example, if you enter 30, the Search mechanism retrieves records for 30 days into the future.
The schedule horizon is not the future horizon!
MSW displays a scheduling horizon within the Schedule Grid; this is not a future horizon. The scheduling horizon that displays includes both a future horizon and a history horizon, which you define through the Preferences window in the workbench. When the system retrieves records based on your search criteria, it retrieves all transactional, demand and supply records for item with dates that also match the History and Future Horizon values that you set in Preferences.
Identify Production Items with Supply Shortages Section
Identify Production Items with Supply Shortages
UI Visual Indicators
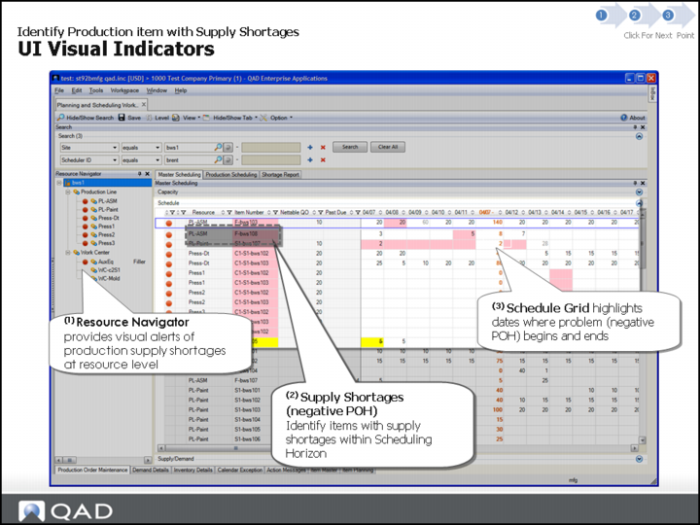
MSW displays visual status indicators to direct your attention to potential capacity and item shortage issues.
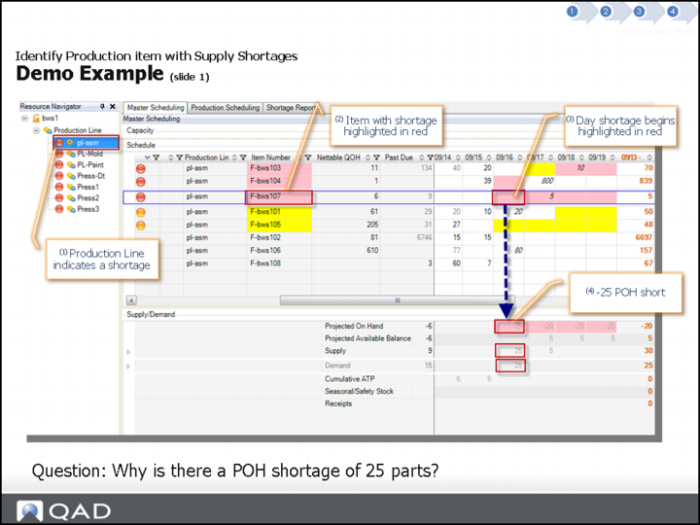
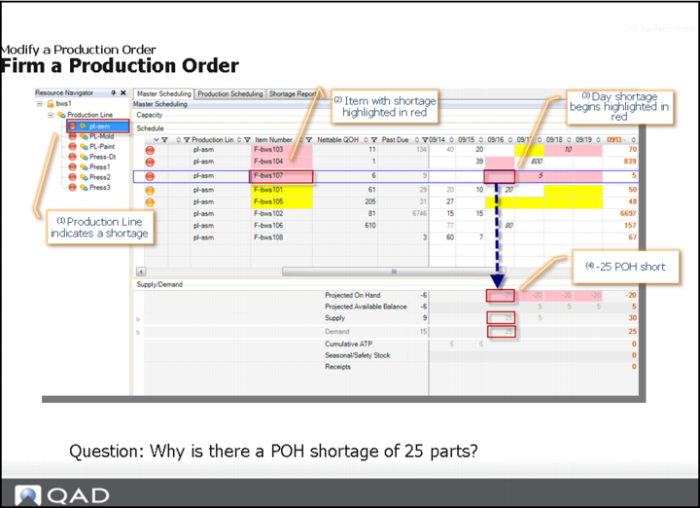
The Resource Navigator Panel highlights each resource with a POH shortage icon when one or more items associated with the resource have a POH shortage within the resources's defined scheduling horizon.
Demo Example 1
Shortage warning status applies to required capacity (the load), available capacity, part number, scheduled quantity, and projected on-hand (POH) quantity.
Shortage warning status indicators can display as low warning status (yellow shading), which typically applies to non-critical potential shortages; for example, when the quantity on hand does not meet safety stock requirements.
High warning status (red shading) indicates a potentially critical capacity or item shortage problem; for example, when the projected on hand quantity is less than zero. The following table summarizes visual indicators.
Question: Why is there a POH shortage of 25 parts?
Demo Example 2
Supply/Demand Panel Section
Supply/Demand Panel
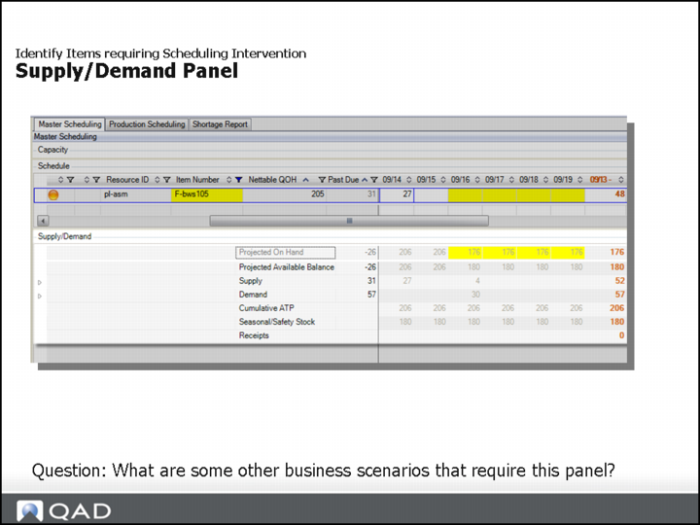
Use the information in the Supply/Demand Grid to view the item’s total demand and total supply data over a period of time. Total demand is from sales, DRP, forecast, seasonal demand, or dependent demand. Total supply is from planned, firm, or released production orders.
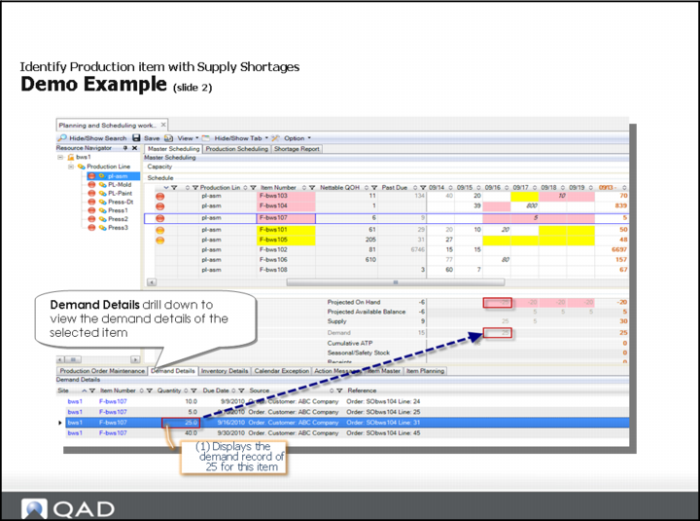
You can select the items with issues, then drill down to the Demand Details panel; for example, to view demand records by ascending due dates. You can then scroll up or down to see additional demand records within the history horizon or future demand. This helps you focus on a specific demand record to correct the issue.
Question: What are other business scenarios that require this panel?
Overview
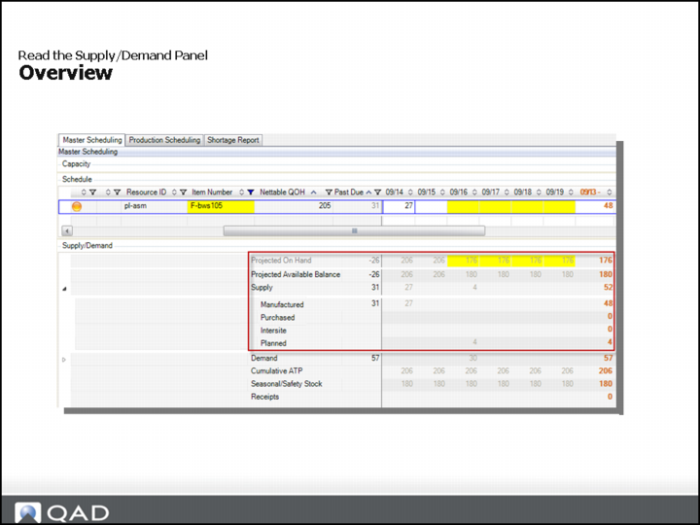
Supply/Demand panel provides context to the item you are scheduling: projected available balance, POH, and supply.
When the Schedule Grid displays the scheduled quantity for an item, the Supply/Demand Grid displays the remaining open quantity due for the item. When the resource selected is a production line or work center, the Supply/Demand Grid displays the quantity and due date per production order.
Sources of demand can include forecasts, safety stock requirements, sales orders, customer scheduled orders, component requirements from manufacturing, and so on. Sources of demand include nettable QOH, production orders, production/purchase orders, supplier scheduled orders, and so on.
Overview (Continued)
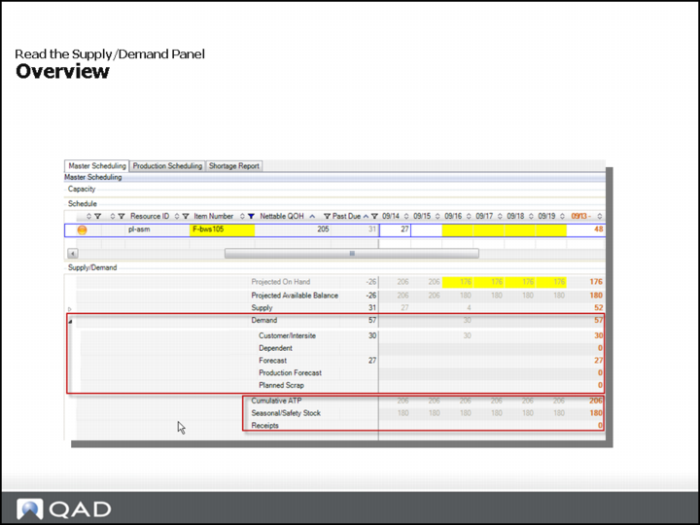
The Supply/Demand Panel provides context to the item you are scheduling:
• Demand: All demand records for the selected item.
• Cumulative ATP: The quantity remaining for sales to promise to customers.
• Seasonal/Safety Stock: Defines the desired targeted inventory balance.
• Receipts: All inventory receipt transactions for the selected item.
Modify Demand Sources Section
Modify Demand Sources
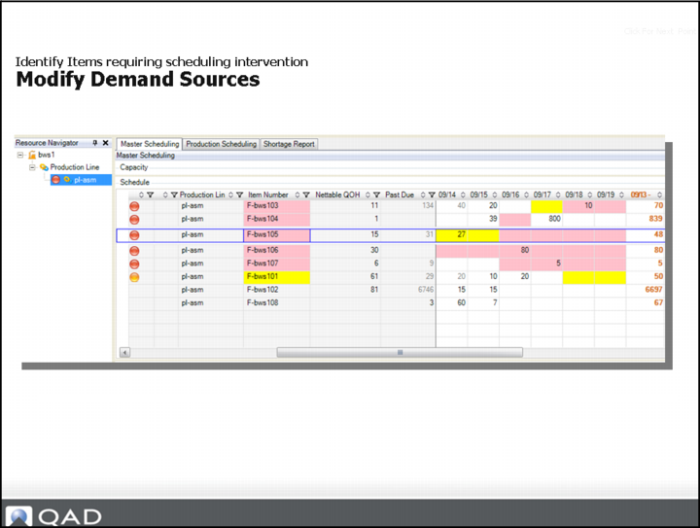
Business Scenario: Several items display visual indicators, but there are limits in the short term to change the master schedule - Which items should you address first?
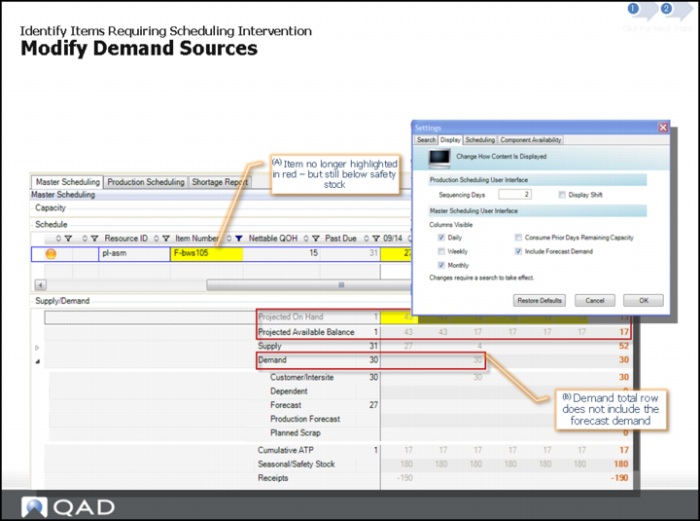
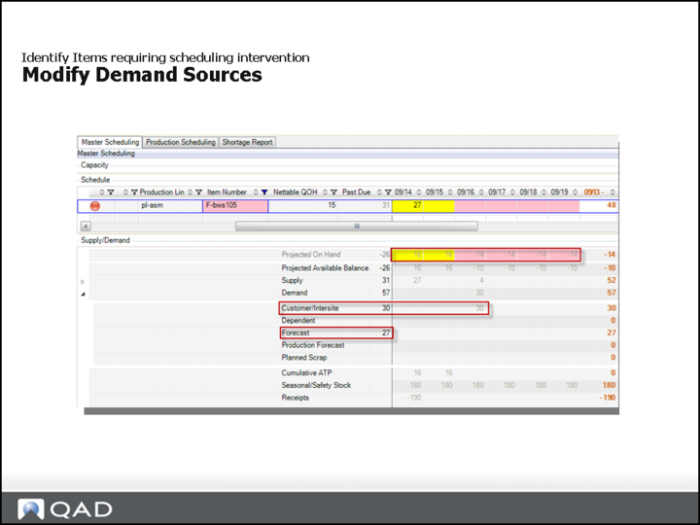
First, you can drill down to supply/demand panel to find the demand. In the example, you can see that the demand is coming from the customer.
Within MSW, you can update status, as well as release, create, or close orders, while considering all demand sources, from the single workbench.
For demand sources:
• Forecast and sales demand records are applied as demand input.
• Forecast demand is considered planned demand input.
• Sales demand is considered firm demand. Sales demand is an input to firm PQOH and planned PQOH.
Modify Demand Sources
Business Scenario: Several items display visual indicators, but there are limits in the short term to change the master schedule - Which items do I address drill down into item details to determine the shortage is partly caused by forecast demand.
You can find item details in the Item Master or Item Planning panels. You can modify item details to include information from any field in the Item Master Maintenance.
Question: What if you calculate item demand, excluding forecast demand?
Modify Demand Sources: Excluding Forecast
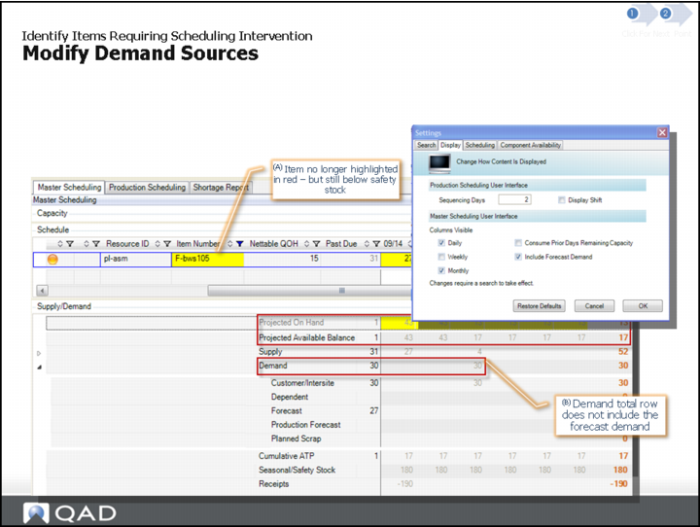
Solution Approach: Ability to exclude forecast demand as a demand source to suppress shortage alerts when:
• Plan to forecast - make to order
• Prioritize per demand source
For MSW to include forecast demand, you must set the Include Forecast Demand option to Yes in the MSW Display Preferences window. When you do, the system displays the net balance of current forecast demand from QAD EE for the selected item. Master production scheduling and MRP use the net forecast and abnormal sales order demand to calculate total demand.
Other Related Topics Section
Other Related Topics
Hands-On Lesson Section
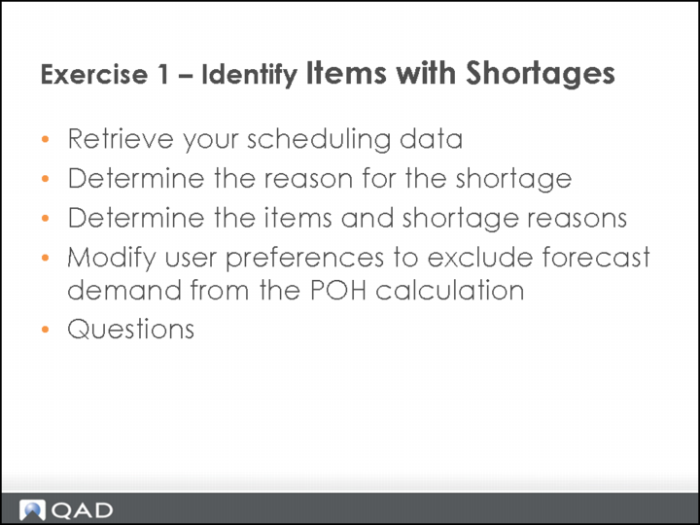
Exercise 1: Identify Items with Shortages
Retrieve your Scheduling Data
1 Enter selection criteria site equals 10-202.
2 Enter Resource equals ASSY-01.
3 In the Navigator Panel, click on the production line ASSY-01.
Notice the red bulb next to the Resource ID on the Navigator Panel, indicating there is a Projected On Hand (POH) shortage for this resource.
Determine the Reason for the Shortage
The resource ASSY-01 indicates a POH shortage. Now, you will attempt to determine the reason for the POH shortage.
1 In the Schedule Grid, click on the item 02303.
The Schedule Grid Date Column for tomorrow should be highlighted in red.
• Question: What is the shortage amount?
2 Open the Supply/Demand panel to view the information to determine the shortage amount.
The system displays -18 POH.
• Question: Looking at the demand and supply records, can you see why POH is -18?
• Question: What would be the most appropriate action to take?
Note: You will correct the shortage in later steps.
Determine the Items and Shortage Reasons
The resource ASSY-01 indicates a POH shortage. Now, you will determine the items and reasons for their shortages.
1 In the Schedule Grid, click on the item 02308.
The system displays POH issue in the future.
• Question: What is the shortage amount?
2 Open the Supply/Demand panel view the information to determine the shortage amount.
3 The system displays -12 POH.
• Questions: Looking at the demand and supply records, can you see why POH is -12?
• Answer: The -12 displays because it is from planned orders.
4 In the Supply/Demand panel, expand the supply row to view the details.
• Notice that there is a planned order quantity for 12 pieces.
• Question: Why does the planned order not display as supply in the POH row?
• Hint: Do you remember the concept/rules concerning the Scheduling Horizon and how this relates to planned work orders?
Continue to Determine the Items and Shortage Reasons
The resource ASSY-01 indicates a POH shortage. Now, you will determine the items and reasons for their shortages.
1 In the Schedule Grid, click on item number 02305.
The system displays POH issue in the future.
• Question: What is the shortage amount?
2 Open the Supply/Demand panel to view the information to determine the shortage amount.
The system displays -26 POH.
• Question: Looking at the demand and supply records, can you see why POH is -26?
3 In the Supply/Demand panel, expand the demand row to view the demand details.
• Question: Where is demand coming from?
• Hint: Notice the past due column of the forecast row and the customer/intersite row.
• Answer: The demand is coming from a customer order.
4 In the Demand Details tab, view the demand details for this item.
• Question: Can you see that demand is coming from both forecasts, customer orders and intersite requests?
• It seems that scheduled shortage is based on a forecasted demand quantity.
• Question: What if you desired to only view items with shortages excluding forecast demand?
Modify User Preferences to Exclude Forecast Demand from the POH Calculation
In the prior scenario, the item 02305 displayed a POH shortage based on forecast demand. Modify your user preferences to exclude forecast demand from the POH calculation, thus ensuring you are only alerted of scheduling issues based on actual, not forecasted, customer demand.
1 In the Toolbar, click Option, then Preferences, then Display.
2 Uncheck the Include Forecast Demand field; then click OK.
3 Do a Search.
4 Open the Supply/Demand panel to view the information to determine the shortage amount.
• The system displays -24 POH.
• Question: Looking at the demand and supply records, can you see why POH is -24?
5 In the Supply/Demand panel, expand the demand row to view the demand details.
• Notice that the Forecast demand record of 24 in the past due column is still shown, but the quantity is not included in the demand summary row.
6 In the Demand Details tab, view the demand details for this item.
• Questions: Can you see that the forecast demand record is still there, but it is no longer included in the demand calculation for the item? How does the forecast demand record continue to impact MRP and lower level components and purchased parts?
7 In the Toolbar, click Option, then Preferences, then Display.
8 Recheck the Include Forecast Demand field; then click OK to re-include forecast demand.
Questions
1 What is the red ball indicating?
2 Which section of the MSW shows you the item’s total demand and total supply data over a period of time?
3 When the Schedule Grid displays the scheduled quantity for an item, what does the Supply/Demand Grid display?
4 Which of the following does the Supply/Demand Panel provide context for when drilling into item data?
• Demand: All demand records for the selected item.
• Cumulative ATP: The quantity remaining for sales to promise to customers.
• Seasonal/Safety Stock: Defines the desired targeted inventory balance.
• Receipts: All inventory receipt transactions for the selected item.
Answers
1 The red ball indicates a shortage when demand exceeds capacity.
2 Shortage warning status indicators can display as low warning status (yellow shading), which typically applies to non-critical potential shortages; for example, when the quantity on hand does not meet safety stock requirements. High warning status (red shading) indicates a potentially critical capacity or item shortage problem; for example, when the projected on hand quantity is less than zero.
3 Use the Supply/Demand Grid to view the item’s total demand and total supply data over a period of time.
4 When the Schedule Grid displays the scheduled quantity for an item, the Supply/Demand Grid displays the remaining open quantity due for the item.
5 All of them.
Schedule Production Orders Section
Schedule Production Orders
Modify Production Order Section
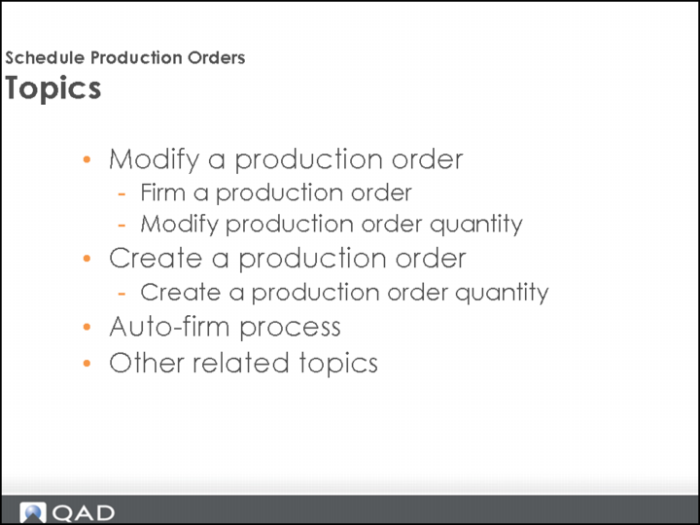
Firm a Production Order
When cells are highlighted red, you can see that the projected on-hand quantity is negative within a firm scheduling period.
Question: Why is there a POH shortage of 25 parts?
Answer: You have a demand of 25, but even though you have a planned receipt, planned orders do not display in the Schedule Grid.
Use the information in the Supply/Demand Grid to view the item’s total demand and total supply data over a period of time. Total demand is from sales, DRP, forecast, seasonal demand, or dependent demand. Total supply is from planned, firm, or released production orders.
Firm a Production Order (Continued)
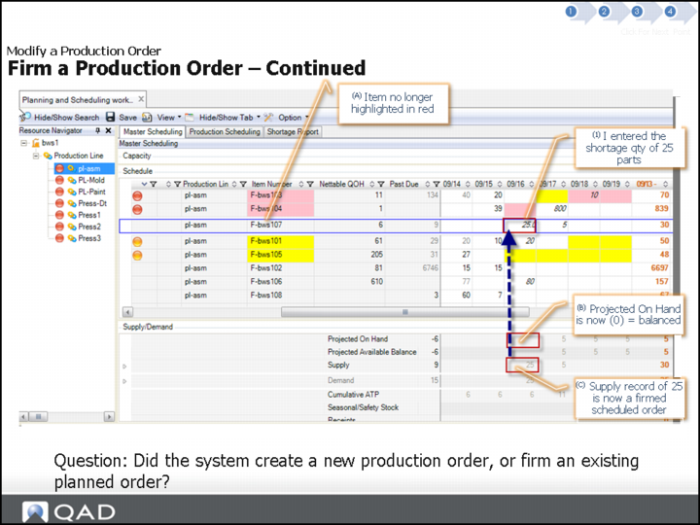
A firm planned order has a production order bill and a routing with scheduled operations.
Question: Did the system create a new order or firm an existing order?
Modify Production Order Quantity
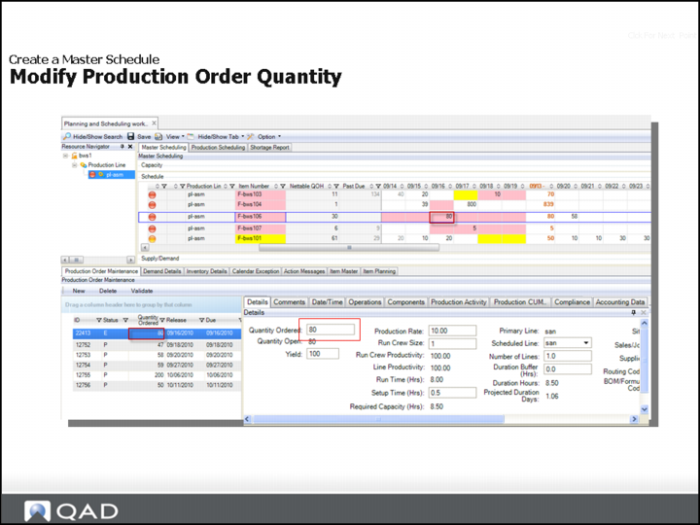
Solution: Update a production order quantity using one of the three UI/methods:
• Directly on the Schedule Grid
• Production Order Maintenance
• Production Order Maintenance Details
Even though MRP generates planned orders, balancing supply and demand, in some cases, you may need to manually adjust the production order quantity. You can use MSW to do this. You can modify quantities directly in the Schedule Grid in any horizon period.
When you make a quantity change against a production order, the quantity change applies to the entire order, not just a specific operation. For example, if you change the quantity on work center A for operation 10, MSW applies the quantity change to the order and, subsequently, all operations.
You cannot modify the value in Schedule Grid:
• If the Schedule Grid cell value represents more than a single production order.
• If the order is closed.
If you change the order quantity to a quantity less than the quantity completed, the changes display in the Supply/Demand Grid. The open quantity is zero when the order quantity is equal to or less than the quantity completed.
Create Production Order Quantity Section
Create a Production Order Quantity
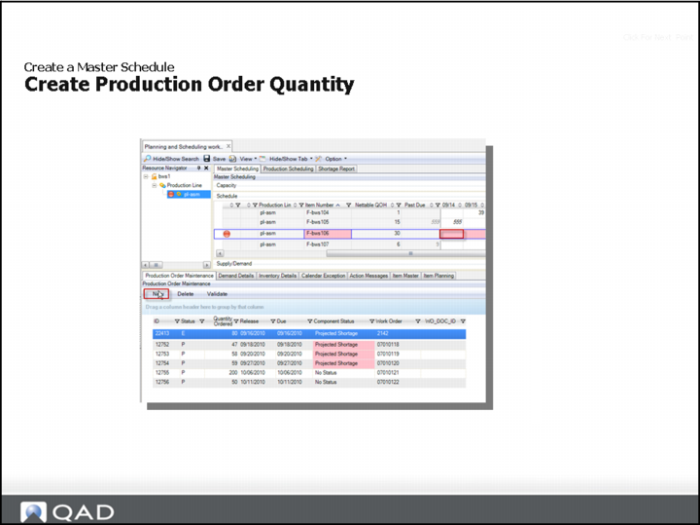
Solution Approach: Create a production order quantity using one of the two UI/methods highlighted below
• Directly on the Schedule Grid
• Click on New in Production Order Maintenance
Auto-Firm Process Section
Overview
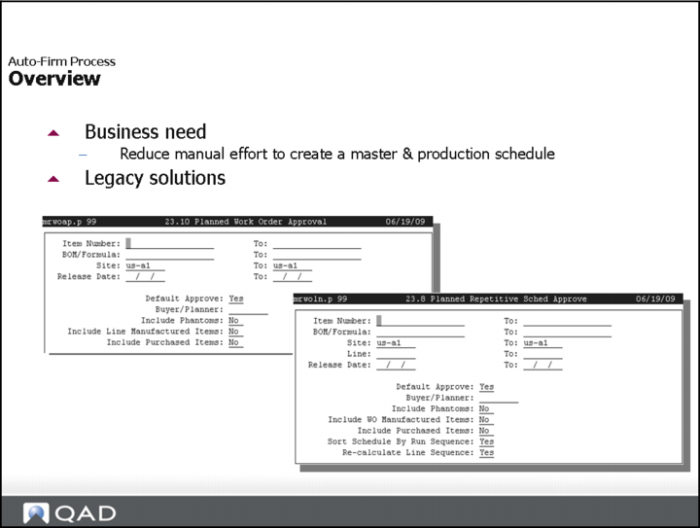
Business need: Reduce manual effort to create a master and production schedule.
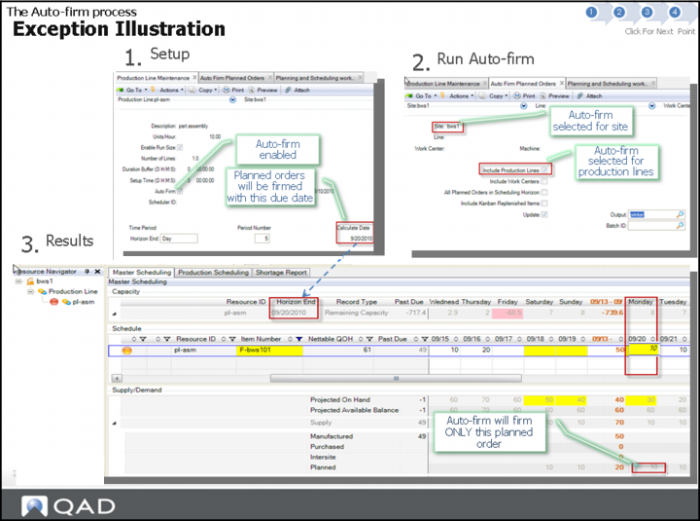
In many businesses, MRP output is the starting point for master production scheduling. You can use the auto-firm function to quickly adjust orders and expedite your scheduling tasks. For discrete and repetitive orders, you no longer need to approve planned production orders to change the status to F. Auto-firming is based on the order due date.
You cannot auto-firm these item types:
• Purchased (items with a P code in Item Master Maintenance (1.4.1)
• Configured
• Routable
• Phantom
You can run the auto-firm process daily in batch mode to avoid missing orders that require this status change.
You can auto-firm orders using programs that are external to the workbenches. The programs firm planned orders for your work centers and production lines for a specific horizon or a range of dates. The program can run in batch mode nightly.
Solution Approach
What is Auto-firm?
• An approach to having the system firm MRP planned production orders.
• The business value is that it enables master scheduling by exception.
When is it applicable to use?
• When MRP is generating accurate planned orders.
• When a high percentage of the orders (95% or greater) are MRP planned orders.
What to decide:
• Do I use this process for all or some of my resources?
• Answer: You should auto-firm resources on a case by case basis.
• Can I still use the legacy firming programs?
For a planned work order approval, the answer is Yes. For a planned repetitive schedule approval, the answer is No.
Illustration Flow
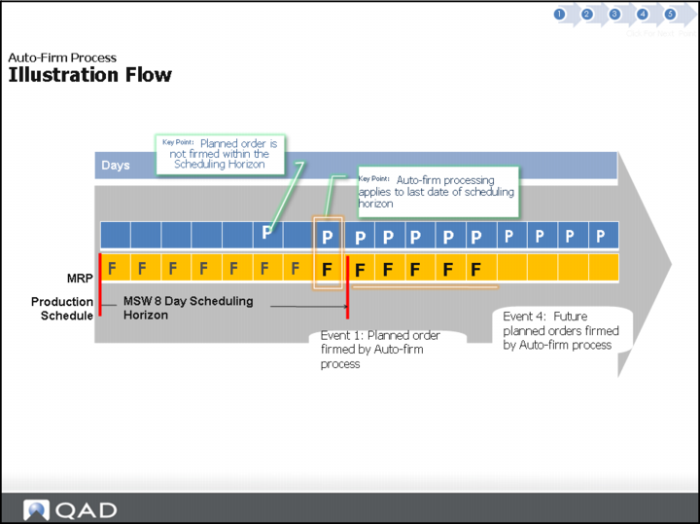
Starting Point: A production schedule with firm orders MRP generated future planned orders.
Event 1: Auto-firm process runs today.
Event 2: new planned order created by MRP today.
Event 3: Auto-firm process runs again today.
Event 4: Auto-firm process runs each day after today.
Exception Illustration
You must set Auto Firm to Yes in both Production Line Maintenance and Work Center Maintenance if you auto-firm for work center resources. If Auto Firm is set to No in these programs, the system will not firm any planned orders. You can see the Auto Firm field status and the date of the last auto-firm in work center and production line browses in QAD EE.
Production Order Types Section
Determine a Production Order Type
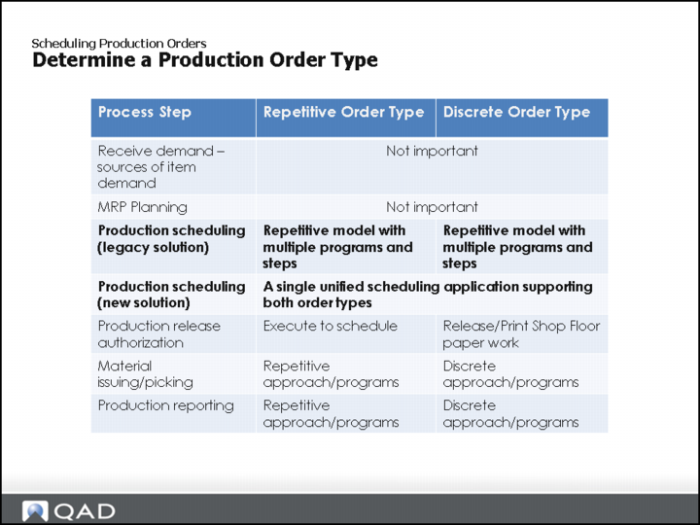
Discrete and Repetitive Production Orders
An item must be classified as discrete or repetitive scheduled.
Production orders are all orders associated with production-—production lines, work centers, or other production areas—including discrete production orders, repetitive orders, scheduled orders, cumulative orders, and so on.
In the Resource navigator, when you select an item from a repetitive order, MSW displays all production lines defined for the item. If you select an item from a discrete order, MSW displays all work centers for the operation, including alternate routings.
Determine a Production Order Maintenance
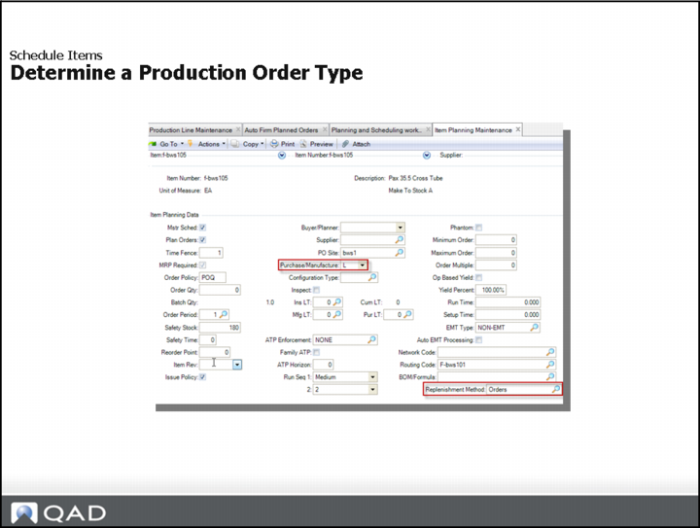
In Item Planning Maintenance, the Pur/Man Code defines the item type:
• L = repetitive
• (all other codes) = discrete
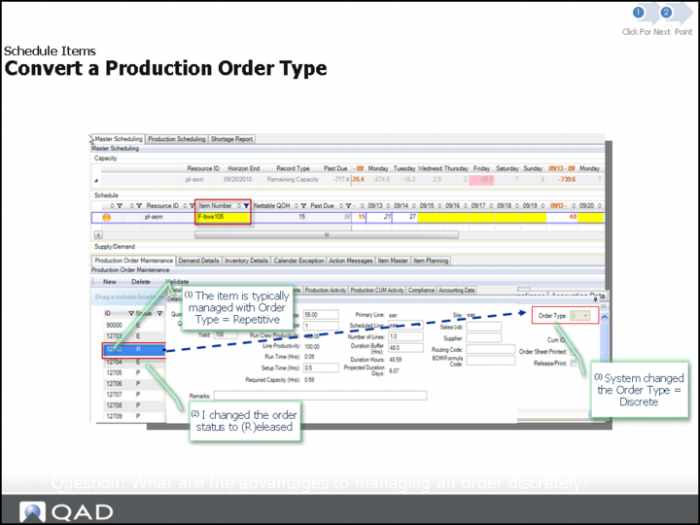
Production order type determined when order is firmed.
The following table shows you the Pur/Mfg codes for production orders and order types.d.
Pur/Mfg Codes for Production Orders
Pur/Mfg Code | Production Order Status | Production Order Type |
N/A | P | Generic |
Blank | F | Discrete |
M | F | Discrete |
L | E | Repetitive |
All others | F | Discrete |
Pur/Man
The Purchase/Manufacture code controls how the system explodes forecasts, plans and creates orders, and calculates costs for the item. Valid code options include P (Purchased), D (DRP), M (Manufactured), R (Routable), C (Configured), W (flow scheduled), F (family) and L (line manufactured.
Note: In Production Order Maintenance, you can find error messages by Filtering on the Error column.
In Item Master Maintenance within QAD EA, you can set the Replenishment Method field.
Replenishment Method
Specify the method to replenish inventory. The default is Orders.
Kanban: Entering kanban creates a kanban record for the item in kanban Kanban is a method of just-in-time (JIT) production that uses standard containers or lot sizes with a single card attached to each. It is a pull system in which work centers use a card to signal that items are to be withdrawn from supply sources. The kanban system defines a communication signal or card indicating that items need replenishment.
Orders: MRP uses order due dates to determine when quantities will be available to replenish inventory.
Purchase/Manufacture: Inventory is replenished by purchasing it from suppliers or manufacturing it internally, typically with work or production orders.
DRP: Inventory is replenished through distributed requirements planning (DRP) intersite requests, which balance supply and demand among sites.
Family: Inventory is replenished through family-level items. Components of the family item are special items that can be any type: manufactured, configured, or another family item.
Routable: Inventory is replenished from items produced internally.
Configured: Inventory is replenished through products that are configured to customer order and produced internally. These are indicated by a Pur/Mfg code of Configured in Item Master Maintenance (1.4.1).
Purchased: Inventory is replenished through purchased items, driven by purchase orders.
Manufactured: Inventory is replenished through manufactured items.
Convert a Production Order Type
Business Scenario: An item is typically defined as an L type, repetitive scheduled order, but customer requests special handling, so schedule the item using discrete processing.
Question: What are the advantages to managing an order discretely?
Other Related Topics Section
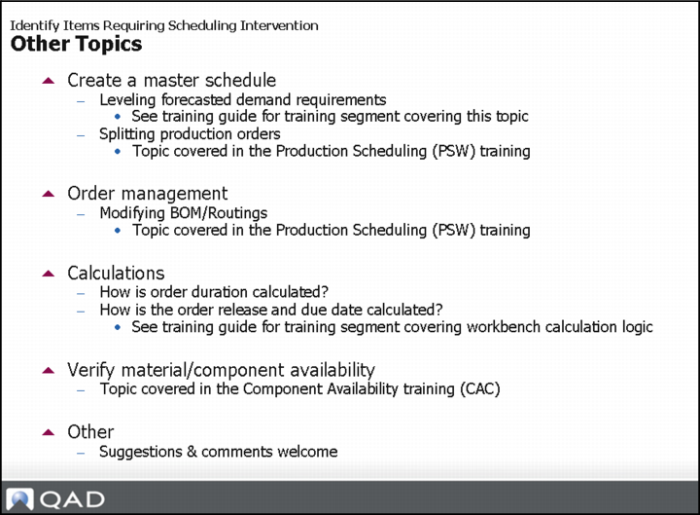
Other Topics
Hands-On Lesson Section
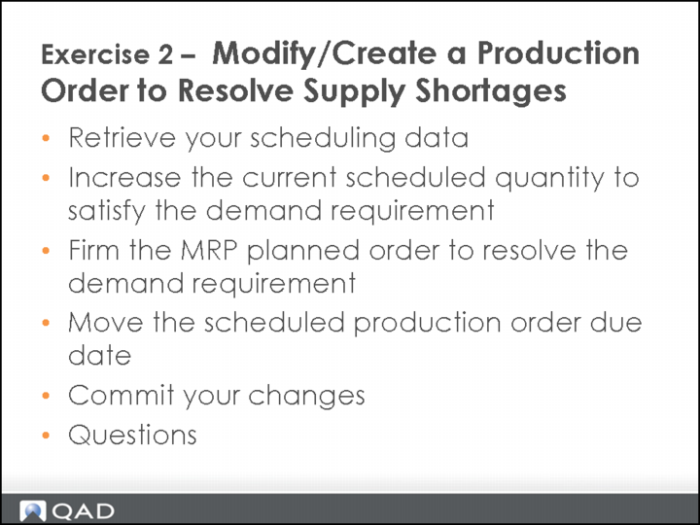
Exercise 2: Resolve Supply Shortages
Retrieve your Scheduling Data
1 Enter selection criteria site equals 10-202.
2 Enter Resource equals ASSY-01.
3 Click Search.
4 In the Navigator Panel, click on the production line ASSY-01.
Notice the red bulb next to the Resource ID on the Navigator Panel, indicating there is a Projected On Hand (POH) shortage for this resource.
Increase the Current Scheduled Quantity to Satisfy the Demand Requirement
The item 02303 indicates a POH shortage. You will increase the current scheduled quantity to satisfy the demand requirement by updating the schedule directly on the MSW Schedule Grid.
1 In the Schedule Grid, click on the item 02303.
The Schedule Grid Date column in the future should be highlighted in red.
• Question: What is the shortage amount?
• Hint: Use the Supply/Demand tab to find out.
2 In the Schedule Grid Date column, maneuver to the grid cell highlighted red; then adjust the scheduled quantity to fix the shortage.
3 Apply change by pressing the Enter key.
The red highlight goes away.
• Question: Did the color change to yellow? If so, why?
• Hint: Check the item safety stock setting.
4 Make a second adjustment to resolve item safety stock yellow issue by adjusting the quantity for date of <today+1> to 48.
The system removes the yellow indicator.
Firm the MRP Planned Order to Resolve the Demand Requirement
The item 02308 indicates a POH shortage. Now, you will firm the MRP planned order to resolve the demand requirement. Use the Production Order Maintenance tab to review and firm the MRP planned order.
1 Change the production order status to F(irm) for the planned order.
This resources the POH shortage.
The firmed order now displays on the Schedule Grid.
The red visual indicator for item is gone, and the shortage is corrected.
Note: If you modify an field on a planned production order, the system automatically firms it for you.
2 Important: Save your scheduling changes.
The system saves your changes. The system displays a warning message.
Move the Scheduled Production Order Due Date
Item 02305 displays a POH shortage based on forecast demand. Move in the scheduled production order due date. Use Production Order Maintenance to review and firm the MRP planned order.
1 In the Schedule Grid, click the item 02305.
The Schedule Grid Date Column for today/tomorrow should be highlighted in red.
• Question: What is the shortage amount?
2 Click the Production Order Maintenance tab, review the orders and find the firm production order for which you can move the due date forward to resource the shortage amount.
• Hint: The order for the quantity of 26, work order ID 90018.
3 Change the production order Due Date to a date that would resolve the shortage.
The red visual indicator for item is gone. The shortage is corrected.
4 Important: Save your changes in Production Order Maintenance.
Questions
1 True or False. You can only modify a production order quantity in Production Order Maintenance.
2 Is there an instance when you cannot modify the quantity in the Schedule Grid?
3 When is the open quantity zero?
4 True or False. When you make a quantity change against a production order, the quantity change applies to the entire order, not just a specific operation.
5 True or False. You can modify quantities directly in the Schedule Grid for all open orders in any horizon period.
Answers
1 False. You can update a production order quantity using one of the three UI/methods highlighted below:
• Directly on the Schedule Grid
• Production Order Maintenance
• Production Order Maintenance Details
2 You cannot modify the value in Schedule Grid:
• If the Schedule Grid cell value represents more than a single production order.
• If the order is closed.
3 The open quantity is zero when the order quantity is equal to or less than the quantity completed or when supply has met demand.
4 True.
5 True.
Manage Resource Capacity Topics Section
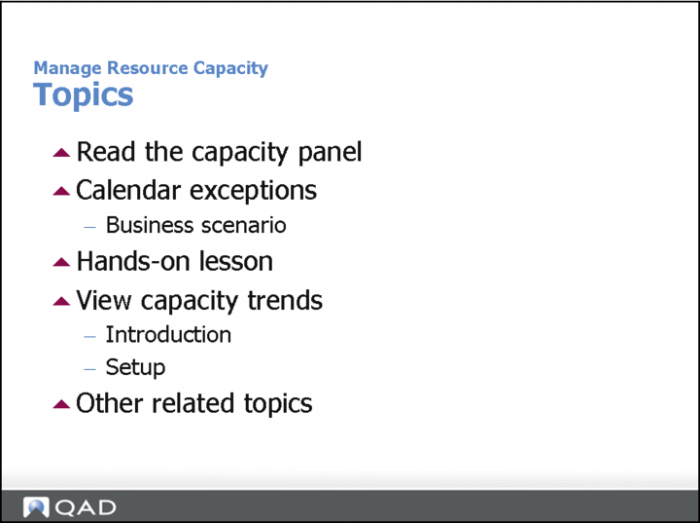
Topics
Read the Capacity Panel Section
Read the Capacity Panel
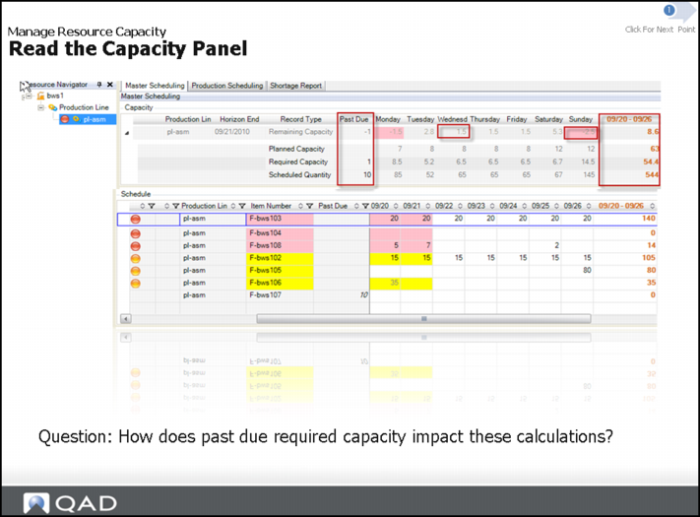
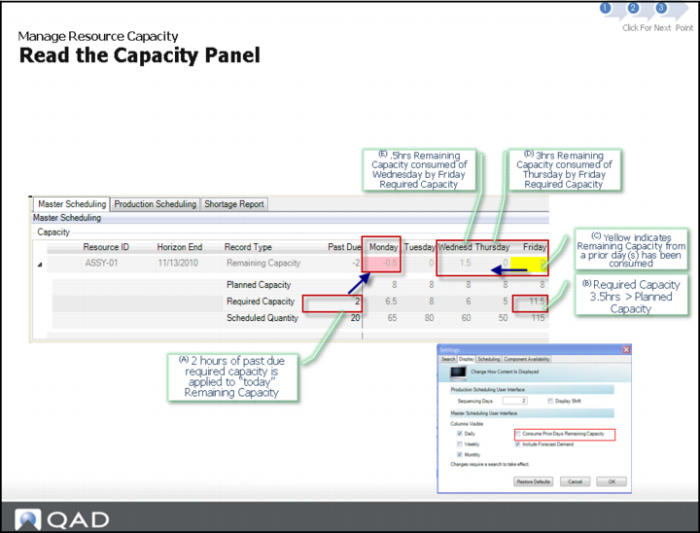
Available capacity information:
• Capacity is defined for each resource.
• Remaining capacity is the primary indicator to over/under capacity situations.
Question: How does past due required capacity impact these calculations?
The Capacity panel includes required capacity and capacity information for the selected resource on each day of the schedule horizon, starting with the current day.
In the Capacity Grid, you can optionally display the daily delta of required and planned capacity in the MSW. You can set the Consume Prior Remaining Capacity field in the Display tab of the User Preferences window so that the capacity row displays.
Note: Currently, in the workbenches you cannot maintain the shift capacity of a work center.
Read the Capacity Panel: Calculations
Calculated Capacity
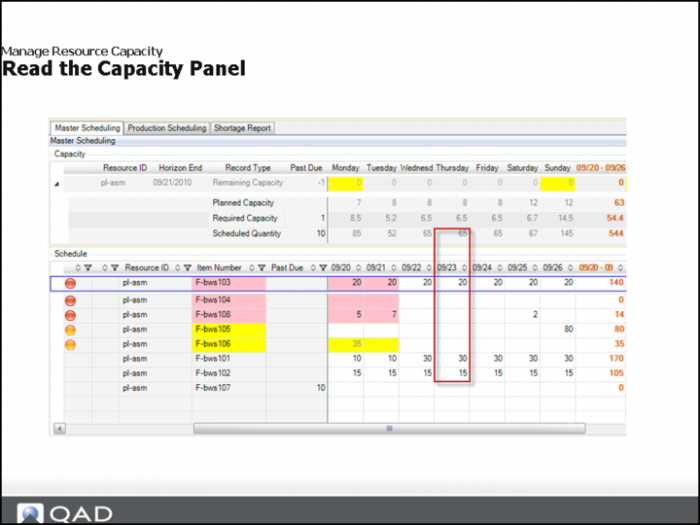
Scheduled quantity is the sum of all production order open quantity per production order due date.
Capacity calculations start from the current system date and include the daily capacity. If the period available capacity results in a negative value, the system attempts to consume the excess capacity available from previous days and continues the consumption until either the period available capacity is zero or all previous days’ excess capacity is consumed.
This calculation runs from the system date until the last day of the schedule horizon. When past due, the period available capacity is zero minus the past due required capacity.
Calculated Required Capacity
Required Capacity
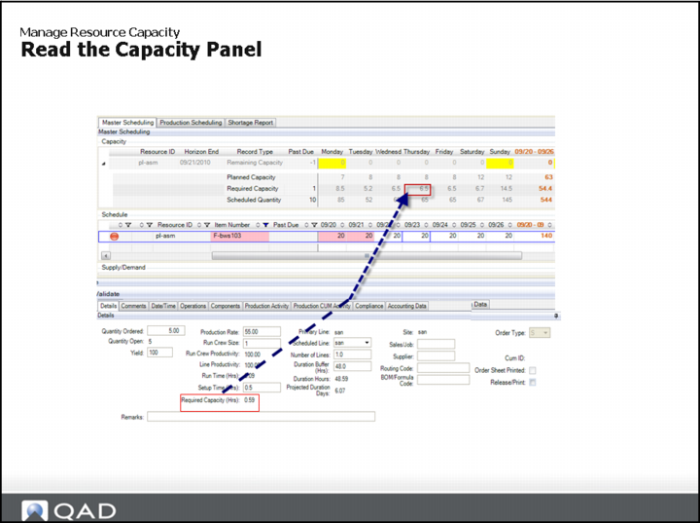
Required Capacity is the sum of all production order required capacity per production order due date.
Calculated required capacity for each order:
Required Capacity: [(Open order QTY / production rate) / production efficiency (from resource calendar) + setup time]
In the MSW, shortage warning status applies to both required capacity and available capacity.
When you make updates to existing quantities in the Schedule Grid, the system performs required capacity calculations and displays changes.
Remaining Capacity
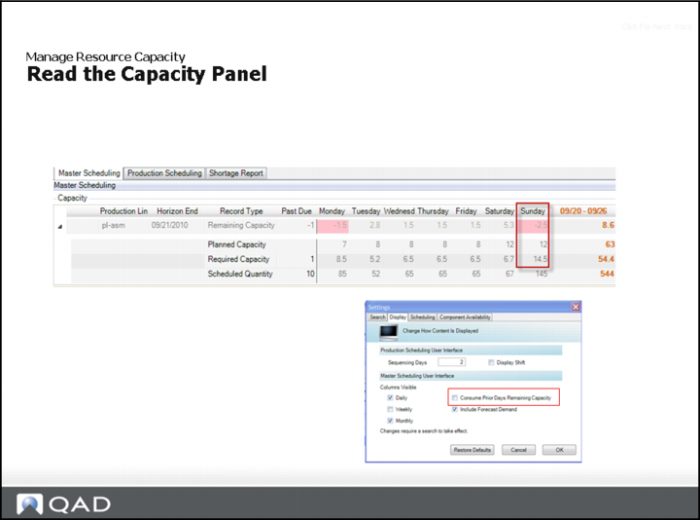
You can specify whether capacity is consumed by future required capacity or not by setting the Consume Prior Remaining Capacity field in the Display Window of User Preferences. Color coding extends beyond the firm scheduling horizon for visibility of capacity shortages. When you set the field to Yes, the cell displays with yellow shading when the system uses available capacity from prior days to satisfy the required capacity. It displays with red shading when there is not enough available capacity on or in days prior to the required capacity date.
Question: What is the limitation of this calculation?
Remaining Capacity (Continued)
Remaining Capacity using Prior Consumption Method
Remaining capacity calculation:
[If(Planned Capacity – Required Capacity is < 0, then consume prior day(s) Remaining Capacity until Remaining Capacity = 0]
Consume Prior Remaining Capacity
Specify whether prior days remaining capacity is consumed by future required capacity.
Yes: The prior days remaining capacity is consumed by future required capacity.
No: The prior days remaining capacity is not consumed by future required capacity.
Questions: What is the primary assumption this calculation method uses? What are the benefits / applications of this calculation?
Compare Calculations
Comparing the Remaining Capacity Calculation Methods
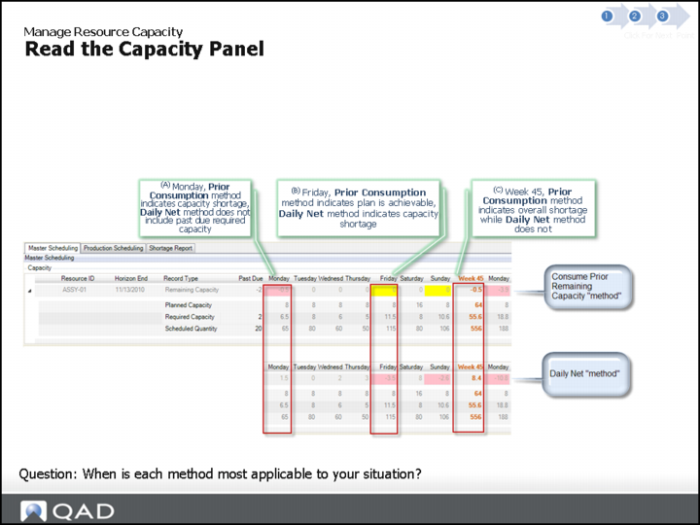
The prior Consumption method determines if you have enough capacity to achieve the due dates defined per the master schedule. This method is ideal when looking at a long-term schedule.
The daily net method determines if you have enough capacity on a daily basis to complete my master schedule. This method is ideal to use when looking at short-term schedule, such as a week.
Question: When is each method most applicable?
Currently, you can only run one method at a time; however, you can switch methods.
Calendar Exceptions Section
Before and After Changes
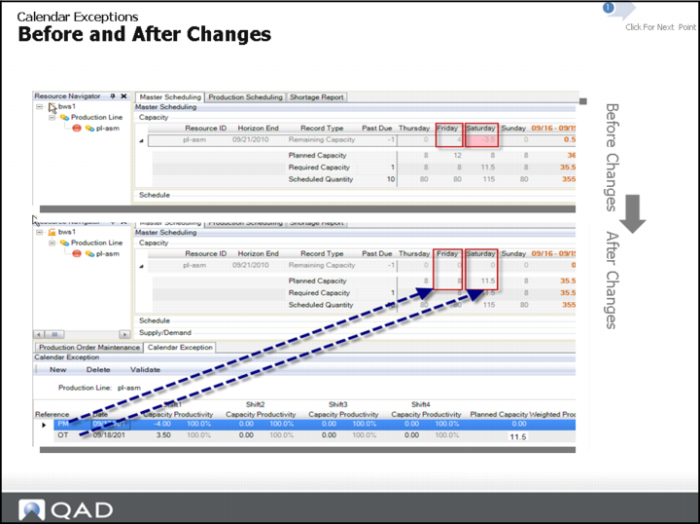
Business Scenario: Your standard capacity is eight hours per day, Monday through Friday. You need to schedule a PM or Downtime to remove capacity on Friday. You are behind schedule and wish to simulate the impact of adding additional capacity for Saturday Assume that you cannot move and production order due dates.
Occasionally, exceptions such as overtime or machine downtime cause changes in productivity and capacity for various shifts. When you set up calendars in Calendar Maintenance, you specify a reference, such as downtime, and the number of hours per day affected. This information displays in the Calendar Exception Maintenance grid within MSW/PSW. Negative numbers can display for downtime or holidays. Holidays are days when no production is scheduled. Holidays differ from site to site.
View Capacity Trends Section
Introduction
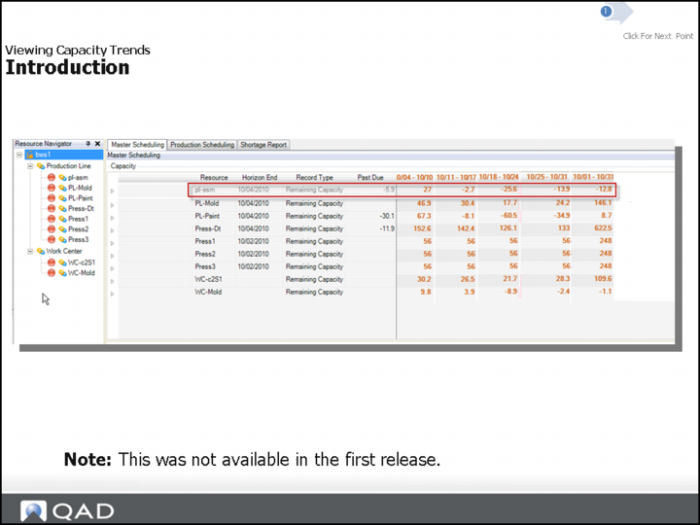
Business Need: Visibility of capacity trends over a period of weeks or months.
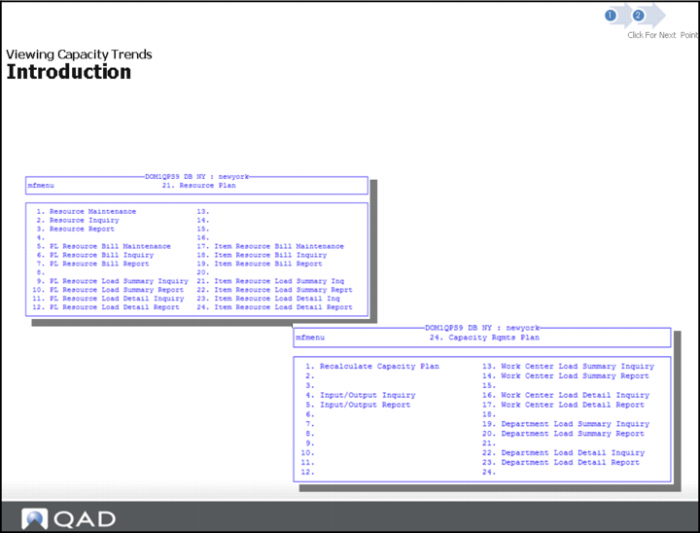
In the past, you could use reports and inquiries to view capacity trends that are shown in the slide above
Required capacity calculations let you see what your capacity trends are over given periods of time. You can determine if your remaining capacity is trending down or trending up. This would be used to determine if you need an extra shift or more resources.
When you select the resource, the system displays capacity in weekly buckets for the selected resource. You can also view the capacity for all resources in the list so that you see that resource load is uniform across all resources.
Introduction (Continued)
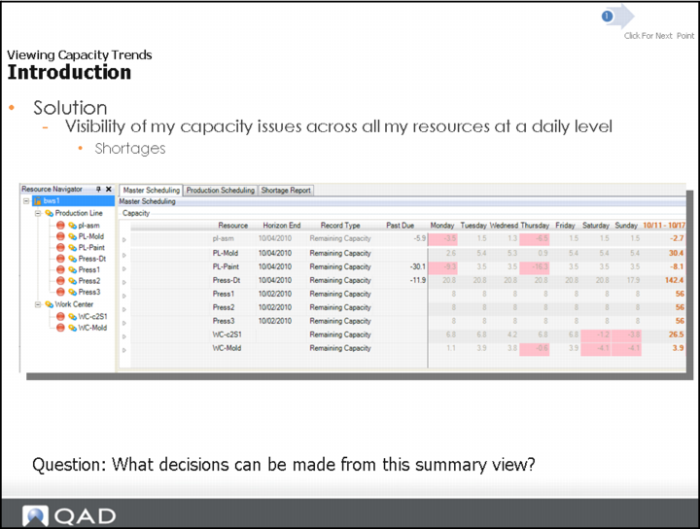
Solution: Visibility of my capacity trends over a period of weeks or months and the past due load.
Question: What decisions can be made from this summary view?
View Capacity Trends: Solutions
Capacity Setup Section
Resource Capacity Hierarchy
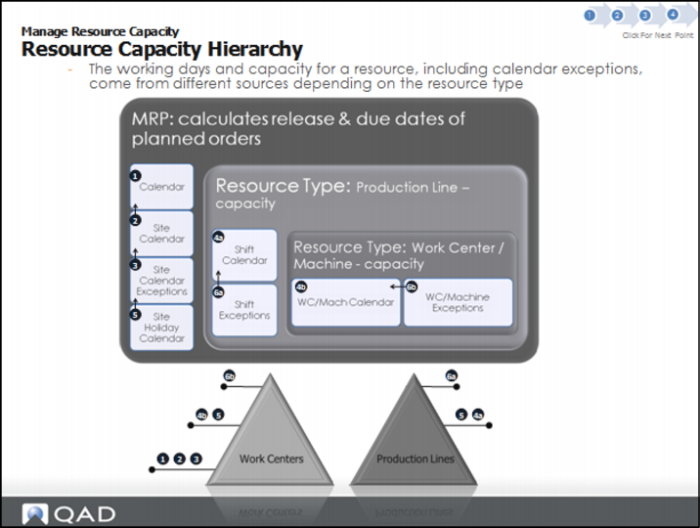
The working days and capacity for a resource, including calendar exceptions, come from different sources depending on the resource type.
Capacity for a work center first looks at calendar (no1 shown above) then site calendar (no. 2), and so on.
The capacity for production lines comes from the shift calendar.
When you set up an exception record (shift exception) for a production line, that record overrides all other records. Note that currently the site holiday record overrides all other records.
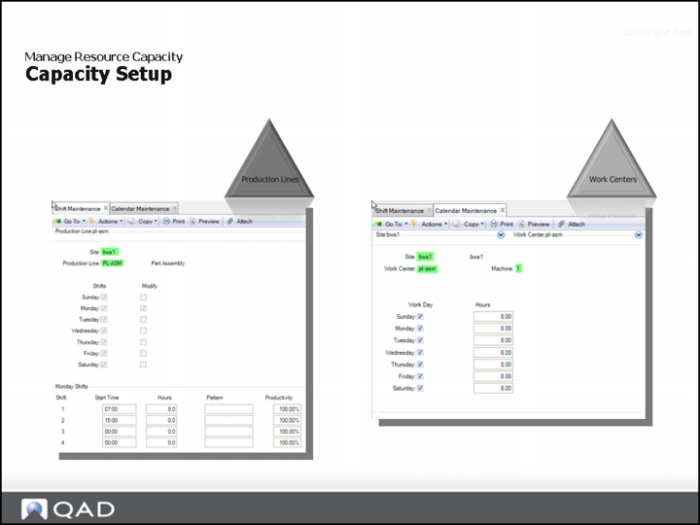
Capacity Setup
Use Calendar Maintenance (36.2.5) to specify normal work days and normal work hours for each site and its work centers. You create shop calendars for manufacturing using Calendar Maintenance, but you use Customer Calendar Maintenance (7.3.1) to create customer calendars. At least one calendar must exist.
You can create unique shop calendars by specifying some fields while leaving others blank. A default shop calendar has a blank site, work center, and machine. The system searches for a shop calendar in the following order:
• For the specific site, work center, and machine combination
• For site and work center with a blank machine
• For site with both work center and machine blank
If shift patterns vary because of overtime, increased or reduced shifts, or plant shutdowns, enter exception hours. Set up exceptions for a date range by specifying the number of hours that are added to or subtracted from normal work hours.
Shop calendars are typically defined in this order:
1 Create a system calendar by leaving site and work center blank.
2 Create a calendar for each site with blank work centers. CRP uses this calendar to calculate capacity, including holidays.
3 Create work center calendars with site and work center filled in.
Other Related Topics
Other Topics
Hands-On Lesson Section
Exercise 3: Review and Manage Resource Capacity
Review Capacity Information to Determine Capacity Issues
In this exercise, you review capacity information for the following two weeks to determine your capacity issues and opportunities. You verify your user preferences are set using the desired capacity calculation method, and use the daily net method.
1 In the Toolbar, click Option, then Preferences, then Display.
2 Uncheck the Consumer Prior Days Remaining Capacity field; then click OK.
3 Run a new search.
4 Enter Site equals 10-202.
5 Enter Resource equals ASSY-01.
6 Click Search.
7 Important: Save your changes.
8 Expand the Capacity Panel to view all four capacity rows.
• Questions: What is your past due capacity and from which part numbers is the load coming? Where is your first capacity shortage? Where is your second?
9 Reviewing the Summary column for this week.
• Question: What is the remaining capacity?
10 Review the capacity information for next week.
• Question: What is the remaining capacity for the week?
Determine the Required Capacity Details of a Specific Production Order
1 In the Schedule Grid, click on the item 02301.
Hint: Do not select order 90017 because production has been reported against this order and the system does not recognize capacity.
2 Select the Date Column for tomorrow.
The Production Order Maintenance panel displays the selected production order record.
3 In Production Order Maintenance Details tab, review the Production Rate, Run Time (hours) and Required Capacity information.
• Question: What is the required capacity for this production order?
4 In the Setup time field of the selected order, enter setup time of 1 hour.
• Questions: Did you notice the required capacity of the order changed? Did you notice the capacity shortage has increased in the Capacity panel?
Increase Capacity and Create a Calendar Exception
You are over capacity for tomorrow. You should increase capacity by creating a calendar exception.
1 Tomorrow should show a capacity shortage of at least -.03 hours. If this is not the case, then ensure your item 02303 has a scheduled quantity for 48 parts for tomorrow.
2 Click the Calendar Exception tab, then click New.
3 In the Reference field, enter OT. (for overtime).
Note: Every calendar exception record should have a reference entered to avoid confusion.
4 In the Date field, select date of tomorrow.
5 In the Capacity panel Shift1 field, enter 2 for two hours, then press Tab to leave the field.
Notice that nothing has happened yet on the UI Capacity Panel.
6 Click Validate.
Notice that the capacity panel has updated.
7 Important: Do NOT save changes.
In the Capacity panel, the system increments planned capacity.
Remaining Capacity is now positive and the system removed the red visual indicator.
Note: Please do not save changes, but if you saved, the calendar exception record would have been saved to the database, in Shift Maintenance, when you clicked the Save button on the workbench. This solution does not update work center capacity yet.
8 Delete the calendar exception record you just created.
Questions
1 True or False. Capacity is defined for each resource.
2 What is the primary indicator to over/under capacity situations?
3 True or False. The Capacity Panel includes required capacity and capacity information for the selected resource on each day of the schedule horizon, starting with the past date you specify.
4 True or False. Capacity calculations start from the current system date and include the daily capacity.
5 In the MSW, shortage warning status applies to both required capacity and what?
Answers
1 True.
2 Remaining capacity is the primary indicator to over/under capacity situations.
3 False. The Capacity Panel includes required capacity and capacity information for the selected resource on each day of the schedule horizon, starting with the current day.
4 True.
5 In the MSW, shortage warning status applies to both required capacity and available capacity.
Exercise 4: Compare and Contrast Capacity Calculation Methods
Retrieve your Scheduling Data
In this exercise, you compare and contrast the differences between the two capacity calculation methods: Consume Prior Days Remaining Capacity and Daily Net Capacity.
1 Enter selection criteria for site equals 10-202.
2 Enter Resource equals ASSY-01.
3 Run a new search.
The system prompts to save your changes.
4 Important: Click Ok, but do NOT save your changes from last step.
Take a Snapshot of the Capacity Panel for Reference
1 Expand the Capacity panel so that you can see all four rows. Maximize the rows.
2 Take a screen shot.
3 Print the screen shot for reference.
Note: Optionally, you can open a second instance of the workbenches and perform the following steps.
Use the Prior Consume Remaining Capacity Method
You wish to review where you have capacity shortages where remaining capacity is negative even after prior remaining capacity is considered to start a production order early. You decide to use the Prior Consume Remaining Capacity method.
1 In the Toolbar, click Option, then Preferences, then Display.
2 Check Consume Prior Days Remaining Capacity field, then click OK.
3 Run a search.
4 Enter Site equals 10-202.
5 Enter Resource equals ASSY-01.
6 Click Search.
7 Expand the Capacity panel to view all four capacity rows, comparing the results to the screen shot using the Daily Net Method.
• Questions: How is the past due required capacity now impacting remaining capacity for today? Where is your first capacity shortage?
8 Review the Summary column for this week.
• Question: What is the remaining capacity?
9 Review the capacity information for the next week.
• Questions: Why is remaining capacity (0) for several days where the required capacity is less than the planned capacity? What do the yellow indicators on the Remaining Capacity row mean?
Level Production for Your Forecasted Items
Demand is lumpy for your forecasted items, so you decide to smooth production for forecasted items and see how the severity of your capacity shortages are reduced.
1 Select item 02306.
2 Starting today, enter a quantity of 10 for each day for the next two weeks.
For each day that you enter a quantity of 10 or modify an existing order to reduce the order to a quantity of 10.
You carefully review the calculated values in all rows in the Capacity Panel before and after you enter the scheduled quantity for each day.
You may have to delete or change the existing orders quantity to 0 (zero) for orders that were previously scheduled in weekly buckets.
Use the Daily Net Capacity Method
You wish to review where you have capacity shortages across all your resources in a single view. You decide to run a search for multiple resources, then use the Daily Net Capacity method.
1 In the Toolbar, click Option, Preferences, then Display.
2 Uncheck the Consume Prior Days Remaining Capacity field, then click OK.
3 Run a search.
4 Enter Site equals 10-202.
5 Enter Resource ID equals Group1.
6 Click Search.
7 In the Navigator panel, click on Site.
8 Open the Capacity Panel wide enough to see all the resources.
The system displays all resources. With this capability, global visibility of resource capacity is possible.
9 In the Navigator Panel, click on Production Lines.
The system displays resources for only production lines.
Question: Is there anything else of value that you can see with this view?
Challenge Exercise
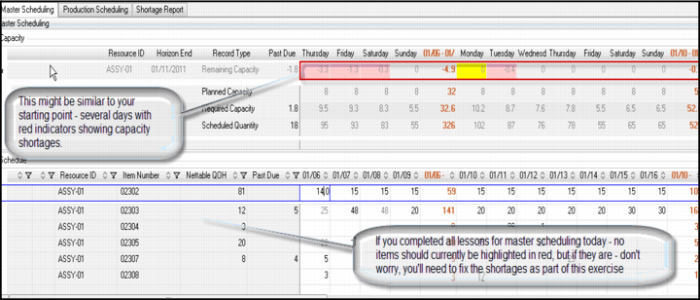
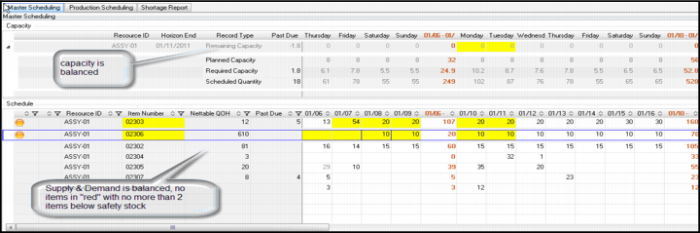
You have now completed the basic lessons to visualize and correct item shortages and monitor resource capacity. To reinforce your new workbench skills, you decide to balance capacity to the production schedule through Sunday of next week.
1 Select resource Assy-01.
2 For this week and next week, ensure that there is no negative remaining capacity.
3 For this week and next week, ensure no items have negative PQOH balances; that is, no items should be highlighted in red.
Note: The following list notes about this challenging exercise:
• Only two parts can be below safety stock.
• You can not move any production order due date beyond the Sunday of next week.
• The later in the week you perform this exercise, the more challenging it becomes.
• You can choose to use either the Daily Net Method or the Prior Consumption Method to assist you in achieving the end goals.
• Hint: Using the Prior Consumption Method is easier to achieve the goal.
The following shows an example of your starting point.
Example Starting Point
The following shows an example ending point.
Example Ending Point
Questions
1 Briefly state the purpose of the Consume Prior Remaining Capacity field and explain the difference when set to Yes and No.
2 Explain how this field setting impacts color changes.
3 The prior Consumption method determines if you have enough capacity to achieve what?
4 The daily net method determines if you have enough capacity to achieve what?
5 Where is the purpose of Calendar Exceptions?
Answers
1 The Consume Prior Remaining Capacity lets users specify whether prior days remaining capacity is consumed by future required capacity. When Yes, the prior days remaining capacity is consumed by future required capacity. When No, the prior days remaining capacity is not consumed by future required capacity.
2 When you set the field to Yes, the cell displays with yellow shading when the system uses available capacity from prior days to satisfy the required capacity. It displays with red shading when there is not enough available capacity on or in days prior to the required capacity date.
3 The prior Consumption method determines if you have enough capacity to achieve the due dates defined per the master schedule.
4 The daily net method determines if you have enough capacity on a daily basis to complete my master schedule.
5 Occasionally, exceptions such as overtime or machine downtime cause changes in productivity and capacity for various shifts. When you set up calendars in Calendar Maintenance, you specify a reference, such as downtime, and the number of hours per day affected. This information displays in the Calendar Exception Maintenance grid within MSW/PSW.
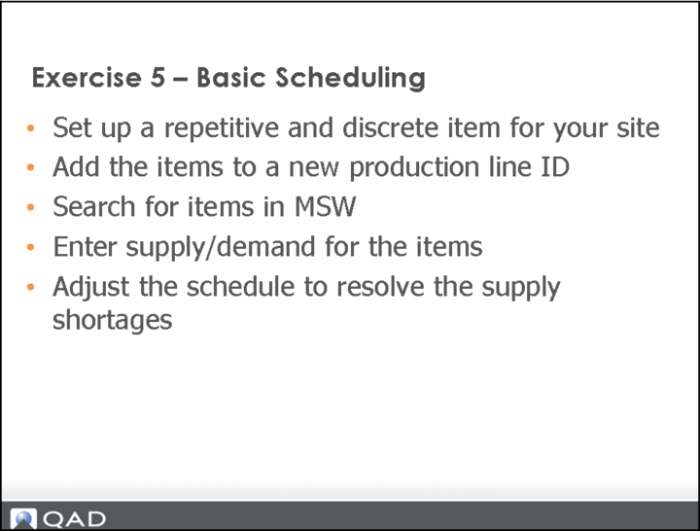
Exercise 5: Basic Scheduling
This final MSW exercise takes you through a complete business scenario of a repetitive scheduled item and a scenario for a discrete scheduled item, starting with data setup and ending with saving your completed scheduling resolutions. The goal is for you to solidify your understanding of the following:
• Creating item supply/demand so it appears on the workbench
• Identifying an item requiring scheduling intervention
• Determining why an order is required
• Firming a production order
• Checking capacity impact
Set Up a Repetitive and Discrete Item for Your Site
You set up data in QAD EE programs first.
1 Set up a repetitive and discrete item number for your chosen site, using Item Data Maintenance (1.4.1).
Add the Items to a New Production Line
2 Add the items to a production line, using Production Line Maintenance (18.22.1.1):
• Add a run rate.
• Define a firm scheduling horizon of at least five days.
Note: Add them to a production line you create; do not add them to existing production lines found in the system.
3 Set up shift capacity for the production line, using Shift Maintenance (18.22.1.22).
4 Run MSW.
• Question: Why did you not see your items?
Enter Supply and Demand for the Items
1 Enter a forecast for your repetitive item for a few weeks, starting this week and a few weeks in the future, using Forecast Maintenance (22.1).
2 Enter safety stock for your discrete item, using Item Planning Maintenance (1.4.7).
3 Run a search in MSW.
• Question: Why does the discrete item still not appear?
4 Run Net Change Materials Plan (23.1) for your site.
5 The system creates planned order for the discrete item.
6 Run a search again in MSW.
The system displays both the repetitive and discrete item
The concept of searching for items with supply or demand is important when understanding when and why items display or do not display in the workbenches.
Adjust the Schedule to Resolve the Supply Shortages
1 In MSW, search and retrieve records.
2 In the Schedule Grid, adjust the schedule for the repetitive item by moving dates.
• Questions: What was the impact on capacity? Do you see the planned orders for future weeks displaying on the Schedule grid? Why does these quantities display on the Schedule Grid even though the orders are planned?
3 Select the discrete item and firm the production order.
• Question: What was the impact to capacity?
Note: Entering a quantity in the Schedule Grid has the same effect.
4 Important: Save your changes.