Dashboard Colors
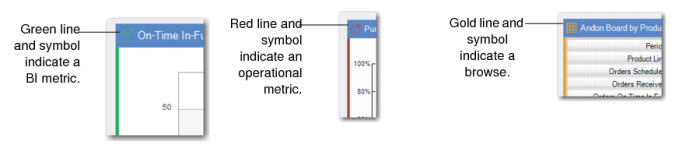
Colors show the source for each of the panels and, in the case of operational metrics and browse-based panels, show how actual performance compares to preset limits. Colors indicate the source of the panel data. A thin color line on the border as well as the color of the symbol adjacent to the name indicate the source of the data in the panel, as shown in
Panel Source Colors.
Panel Source Colors
Colors display within the operational metric panels and indicate the following:
• Green indicates good performance.
• Yellow indicates fair performance but with a caution to watch the performance.
• Red indicates the metric is in poor performance.
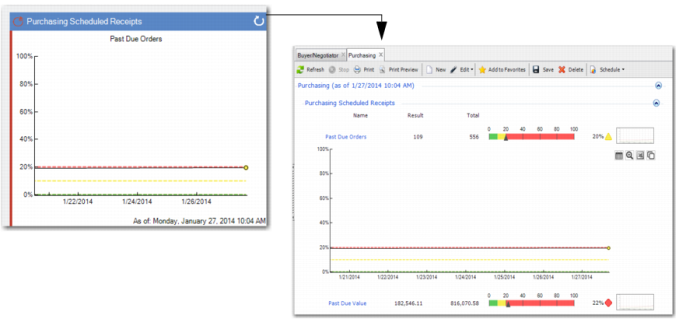
For example, if you view the Purchasing Scheduled Receipts - Past Due Orders within the Buyer/Negotiator dashboard, the color bar indicates the performance. Based on 556 Orders, 109 are past due, which amounts to 20%. Yellow means warning; hence, the buyer/negotiator should monitor this metric to make sure it does not turn red.
Important: Each operational metric has a different user-set range—or threshold—for green, yellow, and red.
Color in Operational Metric Panels
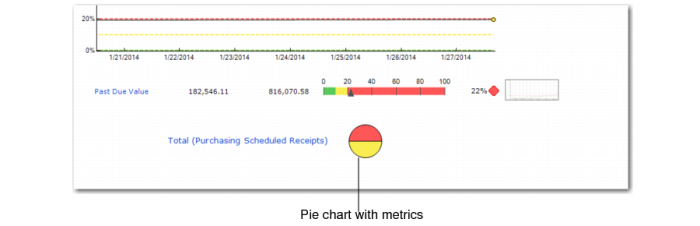
In some operational metrics, the totals are shown in a pie chart. For example, in Purchasing Scheduled Receipts in the Buyer/Negotiator dashboard, you can either view Past Due Orders or Past Due Value, and each is represented in the total with a different color. So, when you click the main panel to view supporting data, you can see a pie chart that represents both metrics, with past due orders as yellow, and past due value as red.
Color for Grouped Metrics
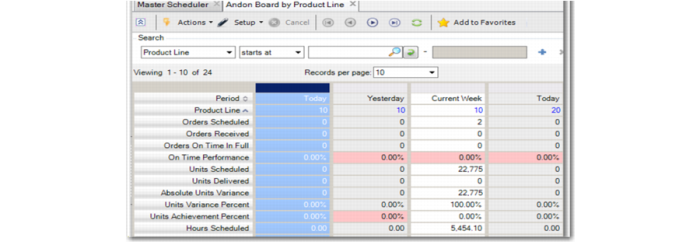
Browse-based panels, like the Andon Board shown in
Andon Board Colors, may also use color coding to indicate good (green), fair (yellow), and poor (red) performance. For example, in the Production Andon Board that shows yesterday’s performance, there are statistics for on-time and in-full schedule performance, for volume performance against the day’s plan measured in units, and volume performance against the day’s plan measured in standard hours. Color coding indicates the performance of the resource in question for each of these three measurements.
Note: Unlike the user-set thresholds in the operational metrics-based panels, the Production Andon Board panels have thresholds that you cannot change. Refer to
Andon Boards for the various thresholds in use.
Color in Browse-Based Panels