Manufacturing Dashboards > Master Scheduler > Andon Boards
  
Andon Boards
The Master Scheduler dashboard—and other supply/demand oriented dashboards—provide Andon Board panels. The topics below discuss:
Different versions of the Andon Board
Andon Board by Item
Andon Board by Product Line
Andon Board by Production Line
Different statistics on the Andon Boards
Mix performance (on-time and in-full performance for orders)
Volume performance measured in inventory units
Volume performance measured in standard hours
Andon Board Color Coding
Andon Board by Item
This Andon board collects and displays data about manufacturing mix and volume performance in the recent past for a particular item or items. In the Item Andon board:
You select items by item number and can view performance for that item and only that item. This might be useful in situations where a product line is almost completely dedicated to a single item.
Mix performance refers to the on-time and in-full delivery performance for orders received in a period.
Volume performance refers to the number of hours and units that were actually received in a period, measured against the total hours and units scheduled. Volume statistics are accumulated for both units and standard hours.
The recent past can include any combination of prior-day performance, current-day performance, and current week to date.
The system displays data for a single item or multiple items. You can view on-time performance statistics (mix) for the orders received in the period and measurements of whether the family is achieving the required volumes based on the schedule. For more information, see Andon Board Statistics.
The Andon Board by Item tab shows browse controls and the data displayed on the Andon Board by Item panel on the Dashboard as well as five subtabs showing source data on the orders and deliveries. The subtabs are:
Work Orders Scheduled
Work Orders Received
Work Orders on Time and In Full
Work Order Receipt Transactions
Work Order OTIF Receipts
Andon Board by Product Line
This Andon board collects and displays data about manufacturing mix and volume performance in the recent past for a particular family of products. In this display, items are selected based on the family coding product line in the item master.
Product lines are typically some grouping of similar items, often based on markets or marketing characteristics, as opposed to manufacturing characteristics or resources (production lines) deployed.
Note: Mix performance, volume performance, and recent past are described in Andon Board Color Coding.
For the selected product line and period, the system displays on-time performance statistics (mix) for the orders received in the period and measurements of whether the family is achieving the required volumes based on the schedule. For more information, see Andon Board Statistics.
The Andon Board by Product Line tab shows browse controls and the data displayed on the Andon Board by Product Line panel on the Dashboard, as well as five subtabs showing source data on the orders and deliveries. The subtabs are:
Work Orders Scheduled
Work Orders Received
Work Orders on Time and In Full
Work Order Receipt Transactions
Work Order OTIF Receipts
Andon Board by Production Line
This Andon board collects and displays data about manufacturing mix and volume performance in the recent past for all the products produced on a particular production line or lines. In this display, items are selected based on the production line on which they are produced. By selecting a specific production line, you can view performance for all the products produced on that line.
Note: Mix performance, volume performance, and recent past are described in Andon Board Color Coding.
For the selected production line and period, the system displays on-time performance statistics (mix) for the orders received in the period and measurements of whether the family is achieving the required volumes based on the schedule. For more information, see Andon Board Statistics.
The Andon Board by Production Line tab shows browse controls and the data displayed on the Andon Board by Production Line. The subtabs are:
Work Orders Scheduled
Work Orders Received
Work Orders on Time and In Full
Work Order Receipt Transactions
Work Order OTIF Receipts
You can click on the Andon Board panel to get to the main browse and associated sub-browses and from there you can click on linked fields. When the material is moved you should differentiate between clicking on the record (in the case of the Andon Board for a specific period and production line, product line or item) to change the content of the sub-browses and right-clicking on a field to access a menu of related functions that you can open.
Andon Board Statistics
The following table describes mix and volume statistics as shown in the Andon Board by Item. Mix statistics in the Andon Board for the current day show close to real-time performance for the orders received during the day. At any point in the day, you can see the percentage of orders received so far that day that were actually on time and in full. This is possible because the metric is based on the orders that were received in the period and not on the orders scheduled in the period.
Volume statistics are based on a comparison of the volume received versus the volume scheduled. As such, the volume performance statistics increase over the course of the day as additional quantities are received. To understand whether the necessary volumes are being produced over the course of the day, you should have a sense of how far into the day it is currently versus the percentage achievement. For example, if the percentage achievement is shown as 50% but the day is 90% over, then the necessary volumes are not being produced.
You can click on the panel to open a tab showing the full set of performance data (all mix and volume statistics including the hours statistics not shown on the dashboard) as well as the detailed data behind the statistics.

Andon Board Statistics
 
Mix statistics
 
Orders scheduled
Count of orders scheduled for the period.
 
Orders received
Count of orders received in the period. Note that this is not a count of the number of receipts against an order. The system counts an order only once in a period, regardless of the number of receipts.
 
Orders on time in full
Count of orders that were closed in the period, or received to within 5% of the full order quantity, and that were received on-time. For an order to be counted as on-time, all receipts against the order must be done on the day when the order was scheduled to be due.
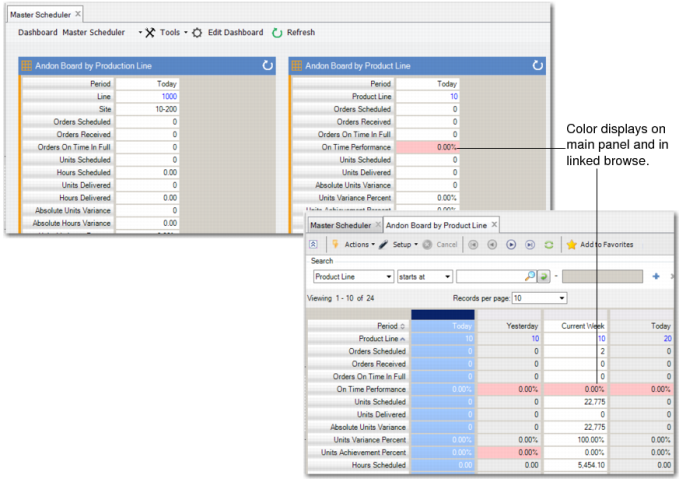
 
On time performance
Percentage of all orders received that were on-time and in-full. The on-time performance is the (number of orders received on-time and in-full / number of orders received) x 100%.
Volume in units statistics
 
Units scheduled
Total quantity scheduled for delivery in the period. Units scheduled is the sum of all order quantities due in a period.
 
Units delivered
Total quantity actually delivered in the period. Units delivered is the sum of all received quantities in a period.
 
Absolute units variance
The absolute value of the difference between units scheduled and units delivered. Absolute value is (units scheduled for delivery - units actually delivered).
 
Units variance percent
The variability between the units delivered and units schedule. Units variance percent is (absolute units variance / units scheduled) x 100%.
 
Units achievement percent
The percentage of volume scheduled for the period that was delivered in the period. This is (units delivered / units scheduled) x 100%.
Volume in hours statistics
 
Hours scheduled
The quantity scheduled for delivery in the period for each order extended by the run hours for the item from the item master, summarized over all orders. Hours scheduled is the sum of all (order quantities x run hours) due in period.
 
Hours delivered
Total quantity actually delivered in the period for each order extended by the run hours for the item from the item master, summarized over all orders that were received. Hours delivered is the sum of all (received quantities x run hours) in a period.
Additional statistics collected but not displayed (due to space limitations):
 
Absolute hours variance
The absolute value of the difference between hours scheduled and hours delivered. Absolute hours variance is the absolute value (hours scheduled - hours delivered).
 
Hours variance percentage
Shows the variability between the Hours Delivered and Hours Scheduled. Hours variance percent is the absolute hours variance / hours scheduled) x 100%.
 
Hours achievement percentage
Displays how much of the volume scheduled for the period was or has been delivered in the period. Hours achievement percent is the hours delivered / hours scheduled) x 100%.
Andon Board Color Coding
Color coding in the Andon boards is as follows:

Andon Board Colors
 
Color
Meaning
On-time performance
Red
On-time metric on each of the three boards (today, yesterday, current week) when the on-time performance is less than 95%; see Andon Board Colors.
Yellow
On-time metric on each of the three boards (today, yesterday, current week) when the on-time performance is 95% or greater, but less than 98%.
Green
On-time metric on each of the three boards (today, yesterday, current week) when the on-time performance is 98% or higher.
Units and hours achievement
No color
No color displays on the today or current week Andon boards because these metrics remain incomplete until the period ends, For example, when both the units and hours achievement metrics show 50% performance for today, when the production day is 50% over, then this is 100% volume performance thus far; however, when the day is 75% complete, then the performance is only 37.5% of what is expected on the day.
Red
Displays for the units and hours achievements metrics on the yesterday board when the achievement performance is less than 95%, or greater than 105%.
Yellow
Displays for the units and hours Achievements metrics on the yesterday board when the achievement performance is 95% or greater and less than 98%, or greater than 102% and less than or equal to 105%.
Green
Displays for the units and hours achievements metrics on the yesterday board when the achievement performance is between 98% and 102%.
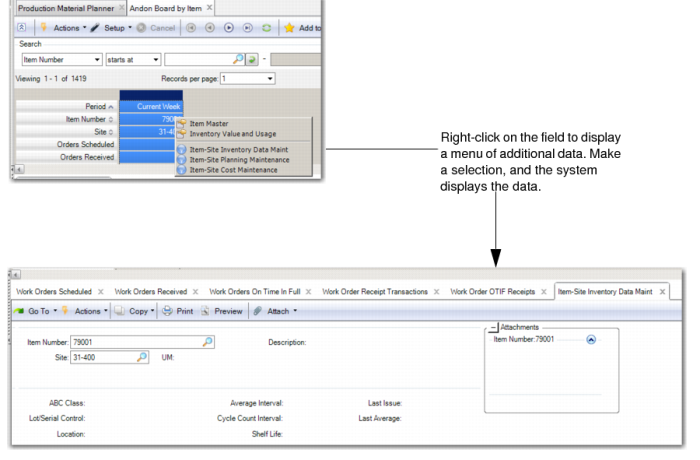
The following graphic depicts Andon Board colors.

Andon Board Colors
Accessing Additional Functions from Andon Boards
The following table lists additional data or functions you can access when you right-click on fields in the Andon boards.

Additional Data
 
From this field
From this Panel
Displays this Additional Data or Function
Item
Andon board by Item
Item Master
Item Value and Usage
Item-Site Inventory Data Maintenance
Item-Site Planning Maintenance
Item-Site Cost Maintenance
Planning and Scheduling Workbenches.
Product Line
Andon board by Product Line
Product Line Master
Product Lines
Product Line Maintenance
Production Line
Andon Board by Production Line
Planning and Scheduling Workbenches
Y
More Data from Fields