Creating the Excel File
Before you can import the report tree and report analysis codes, you need to prepare the data. A template Excel file is delivered with the application (frtree.xlsx).
Alternatively, you can create a tree in Report Tree Maintenance with one analysis code and export this tree to Excel. The exported Excel file can then be used as template. The only thing you need to do is to add more Excel columns for the levels in the tree.
Example: If you need a tree with 5 levels, add 4 more Excel columns with the following headings:
• Analysis code2 (Excel column C row 1) FRWTreeNodeCode2 (Excel column C row 2)
• Analysis code3 (Excel column D row 1) FRWTreeNodeCode3 (Excel column D row 2)
• Analysis code4 (Excel column D row 1) FRWTreeNodeCode4 (Excel column E row 2)
• Analysis code5 (Excel column F row 1) FRWTreeNodeCode5 (Excel column F row 2)
Sample Excel File Using Template
The Excel file has the following properties:
• You can edit the number of columns in the Excel file to suit the number of levels of analysis codes you have in your hierarchy. The maximum number of analysis code columns you can have is 99.
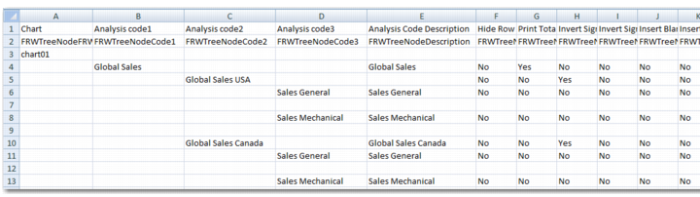
• The Excel file has two header rows. The first row is the label for the user and the second row is the field name for the system. You can hide or remove columns that you do not need. To add a level of analysis code, use the field name FRWTreeNodeCoden. Do not remove the first two rows from the template.
• The Analysis Code Description column (FRWTreeNodeDescription) contains the descriptions for all codes in the tree.
• The chart code is included as the first column and first data row.
• When an analysis code is composed of more than one COA Type dimension, specify the analysis code once with the first COA Type. On the following rows, leave the analysis code blank and specify the additional COA Types and codes.
• You can add as many rows as you want to the Excel sheet. You can also leave blank rows between rows with data.
• Make sure that the columns appear in the order of hierarchy of the analysis codes. For example, when Analysis code 1 is Global Sales and Analysis code 2 is Global Sales USA, the column Analysis code 1 should come directly before Analysis code 2.
Example: If you enter the report analysis code in column B, the level is 1. If you enter the report analysis code in column C, the level is 2. If you enter the report analysis code in column D, the level is 3.
• A tree can contain only one analysis code in Analysis code 1, which is the top-level report analysis code. The report tree does not load properly when there are multiple Analysis code 1 analysis codes.
• Optionally, each report analysis code can have a description. Enter the description in the Analysis Code Description column.
• In the Analysis Type column, specify one of these values:
• A represents Analysis. It allows you to retrieve balances from the report cubes according to criteria specified in the subsequent columns.
• S represents Subtotal. You do not need to enter further details. This node in the tree automatically contains the sum of all underlying detail nodes (child nodes).
• T represents Text. You do not need to enter further details. No amounts are displayed for nodes of this type. You can use text nodes to define a line of text for a report.
• C represents Calculation. Specify a calculation formula in the Calculation column for nodes of this type.
When the analysis type is A, the COA Type Link column is mandatory. It must be one of the values displayed in the drop-down list of the template (entity, GL account, sub-account, cost center, project, layer, daybook, currency, intercompany, and SAFs 1-10). When the analysis type is A, one of these three conditions must be true. Only one condition can be true on one row:
• The columns From Code – To Code must contain a value.
• The column Begins must contain a value.
• Some of the columns List Element 1, List Element 2, through to List Element 999 must contain a value.
The values in List Element 1 and List Element 2 must be real values from the COA used in Report Chart Maintenance. The exception is the use of <blank> to indicate that the report analysis code retrieves data that has no value on this dimension. The <blank> value is supported only for the dimensions sub-account, cost center, project, intercompany, and SAFs 1-10. For From Code – To Code Begins, you can use strings that do not exist as code in the COA. All codes that fulfill the Begins condition or the From Code – To Code condition are selected automatically.
You can have report analysis codes with multiple COA link types. For example, a report analysis code can simultaneously have a link type of GL and a link type of sub-account. This means that the analysis code displays the GL balances of the selected GL accounts when used in combination with the selected sub-accounts. To create combined report analysis codes in the Excel sheet, create two or more subsequent rows with the same report analysis code and a different COA link type for each row. You cannot repeat the same report analysis code with the same COA link type. If you want to target multiple account ranges; create multiple analysis codes, add them together in a calculation code, and only display the calculation code on the report (hiding the details).
The leaves in the tree are of analysis type A. However, it is possible to have type A nodes higher in the hierarchy. This approach imposes additional conditions on the data displayed for complete branches in the tree, in addition to the conditions imposed by the leaves. For example, the leaves of the tree are report analysis codes of type A that select GL accounts. The main branches of the tree have additional report analysis codes of type A that select certain entities, representing the regions. In this example, the same report analysis codes for the leaves (GL) can be reused in many branches.
When the analysis type is C, enter the calculation formula in the Calculation column. You can enter summation type calculations or multiplication and division type calculations. The component analysis codes you use for calculations must be part of the same report tree. This restriction is not validated when you create the report tree; only when you use the tree to run a report.
For more information on summations, multiplication and division, and cascaded calculations, see
Report Analysis Codes.
• XBRL column: Use this column in the Excel template to populate the XBR-related fields of the report analysis code. These fields are used when you create a report with output to an XBRL file (XML type).
• Report Layout Options: Many of the columns in the Excel template are used for report layout options. These options are displayed in
Excel Columns and Functions.
Excel Columns and Functions
Excel Column | Description |
Hide Row | If you want to retrieve or calculate data, but you do not want to display the intermediate results on the report, enter Yes in the Hide Row column. |
Print Total After Detail | The default print layout on a report displays the balances of an analysis code at the point where the code is entered in the hierarchy. This means that, by default, the subtotals are displayed at the beginning of a detail group. If you want the total to appear at the end of the detail group rather than at the beginning, in the Print Total After Detail column, enter Yes. If you apply this option to the highest level node (Level 1), the opening node is automatically hidden. If you apply this option to other nodes, the beginning node displays the code and description, but no total amounts. |
Invert Sign of Activity | On the report, some columns display balances and other columns display activity for the selected period. When activity is displayed as Debit (ActivityDR) or as Credit (ActivityCR) separately, the amount is always positive. When the total activity is printed (DR and CR together), the system calculates DR - CR. The system represents the value as a positive amount when the result is debit or as a negative amount when the result is credit. If you want to represent the activity with an inverted sign (positive becomes negative and negative becomes positive), enter Yes in this Excel column. The sign is inverted before calculations are performed and the subtotals are summed. |
Invert Sign of Balance | On the report, some columns display balances and other columns display activity for the selected period. Balances (opening balances or closing balances) appear as positive when they have a debit sign and negative when they have a credit sign. On some reports, you may want to represent some balances with the inverted sign. This situation occurs frequently on income statement reports, where sales are credited and expense is debited, but you want to represent the sales as positive amounts and the expenses as negative amounts. To invert the balance sign, enter Yes in this Excel column. The inverted sign is applied before calculations take place and the column is filled. |
Insert Blank Row Before | To insert a blank line on the report at the start of a new section to aid visibility, enter Yes in this Excel column. The blank line appears just before the node where you set the value to Yes. |
Insert Blank Row After | To insert a blank line on the report under header text or at the end of a section to make the report more readable, enter Yes in this Excel column. The blank line appears just after the node where you set the value to Yes. |
Row Style | In this column, you can format a report with bold, underlined, and highlighted text. The three keywords are bold, line, and high. Simply include the keywords you want, each separated by a comma. For example, to format a report as bold and highlighted, enter bold high in this column. This field is also available in Report Tree Maintenance. |
Taxonomy | There are multiple XBRL taxonomies, including IFRS XBRL and US GAAP XBRL, each with their own specific structures and element naming conventions. Use this field to store the taxonomy to which the report analysis code belongs. |
ELR | Each taxonomy can have several subdivisions, each targeting a sub-area in the reporting with its own relational structure, label structure, and so on. These subdivisions are referred to as ELRs. At its most granular level, an ELR can relate to just one report. Use this field to specify the ELR code that identifies the report structure in the taxonomy. |
XBRL Element | The XML element name (tag) used in the XBRL taxonomy. For example, each balance row in the IFRS XBRL taxonomy has a unique XBRL element name as an identifier (for example, AssetsAbstract). |
Comment | For report analysis codes of type T, you can enter a large amount of comment text in this field. The comment text is then printed on the report. |
Show Details | Enter Yes for any leaf node for which you want to print GL transactions in detail on a report. For this option to take effect, you must choose the Selected value in the Print GL Transactions field in Report Master Create. When running the report in Financial Report Run, you must also set the Print Details report selection criteria to Yes. |