Report Tree Drill Down
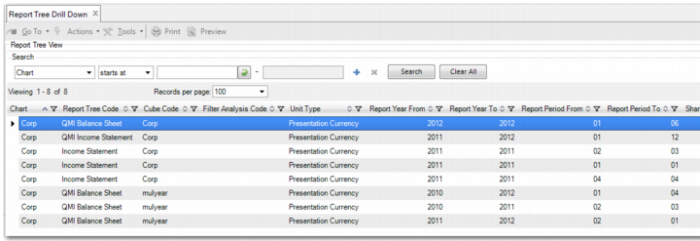
Each view that you create is displayed in a line in Report Tree Drill Down (25.16.7.4). Each column in the Report Tree View grid corresponds to a field in Report Tree View Create. In addition to these columns, the first column in the grid—the Chart column—enables you to see the views related to a particular chart of accounts, as displayed in
Report Tree Drill Down, Report Tree View Area.
Report Tree Drill Down, Report Tree View Area
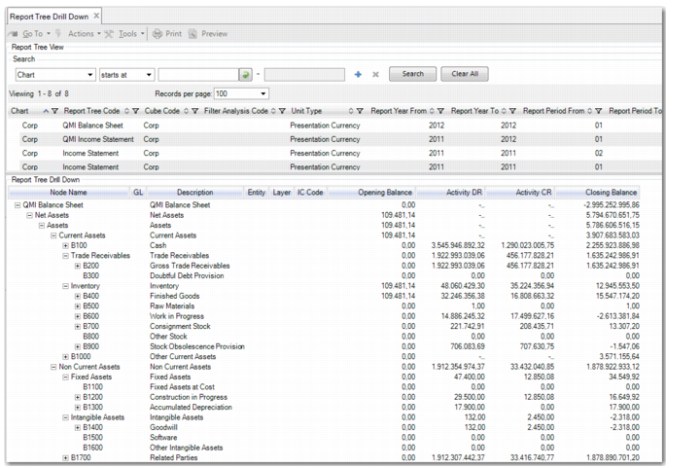
To begin your analysis, double-click the report tree view row you want to view. The tree is displayed in the Report Tree Drill Down area. You can drag the bar to make the Report Tree Drill Down area bigger. It is displayed in the same hierarchy as in the financial report. You can now explore elements in the hierarchy step-by-step. By default, the report tree is displayed with all nodes expanded, except for the deepest level. The deepest level contains the balances as stored in the report cube. To view a particular balance, expand its parent node.
Report Tree Drill Down, Report Tree View Area
The columns in the Report Tree Drill Down area give you a consolidated view of the report tree. The columns displayed correspond to the dimensions in the report cube. Therefore, you can see different columns, depending on the report cube that the view is based on. Some dimensions are always available such as entity, layer, and intercompany code. For more details on cube dimensions, see
Generating Cubes.
To make it easier for you to organize the data, you can drag and drop the columns into different positions on the screen. To move a column, click the column header you want to move and drag it to the required position. When you perform this operation, red arrows are displayed to guide you.
Note: When the presentation currency is set in Report Tree View Create, the decimal digit number is displayed for all amounts according to the rounding setting of the presentation currency. Set the currency rounding in Currency Modify (26.1.2). If the report tree view uses the cube source currency, the decimal digit number in Report Tree Drill Down is two.
Context Menu
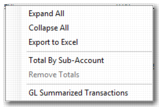
When you right-click a line in the Report Tree Drill Down area, a context menu is displayed. This context menu enables you to perform various operations on the report tree hierarchy. For example, you can group the data to suit your needs, drill down to transaction level, and export a snapshot of the report to Excel.
Report Tree Drill Down, Context Menu
Expand All
This option enables you to expand all nodes in the report tree hierarchy. The expansion can take some time if you are retrieving many balances from the cube.
Collapse All
This option collapses all the nodes in the report tree hierarchy. Only the top-level node is displayed.
Export to Excel
When you select Export to Excel, you export the whole tree to Excel. The tree is exported exactly as you have it displayed in the Report Tree Drill Down. In Excel, you can also conduct further analysis by expanding and collapsing nodes with one click.
Total By
At the deepest levels, you can group the data to make totals or subtotals for any of the dimensions. For example, you can right-click anywhere in the Entity column and retrieve totals per entity. You can group further by GL and see the totals at GL level. You can then drag and drop columns next to each other for improved readability. You can add as many totals as you want. In the example in
Report Tree Drill Down, Context Menu, the user has clicked in the Sub-Account column. Therefore, the Total By Sub-Account option is displayed.
Remove Totals
After you add totals, the Remove Totals option is available. When you select this option, all totals are removed.
GL Summarized Transactions
When there are no totals on the tree and you right-click a line that has activity in the displayed period, you can select GL Summarized Transactions. This facility enables you to drill deeper than the balances displayed in the report tree hierarchy. When you choose GL Summarized Transactions, the system displays the Report Tree View Browse for GL Summarized Transactions. This browse displays the balances in the source entities (PostingHist table) that contribute to the balance in the report tree row. From this window, you can drill into the GL transactions and view the original transaction if you know the type of transaction you are looking for.
For example, to view an original supplier invoice:
1 In Report Tree Drill Down, right-click the activity line of interest and select GL Summarized Transactions.
The Report Tree View Browse for GL Summarized Transactions is displayed.
2 Right-click the line of interest and select GL Transactions.
The Posting Browse for GL Transactions is displayed.
3 To view the original transaction, right-click the relevant line and click View Supplier Invoice.