Fault Codes Pop-Up
If Fault Codes is Yes, a pop-up window for recording codes displays as illustrated in
Fault Codes Pop‑Up. Fault codes are tied to a particular line, as indicated by the heading of the pop-up window. You typically enter fault codes after work on the call is complete and specific data is available regarding the problem and resolution. You can use this data for generating custom call reports.
Fault Codes Pop‑Up
Line
You can enter more than one line of information. The system increments the line number.
Problem
Set up problem codes in Generalized Codes Maintenance for field ccd_problem. These codes are generally more specific than the call problem on the call header.
Cause
Set up cause codes in Generalized Codes Maintenance for field ccd_cause. Use these codes to categorize the source of the problems reported on calls.
Resolved
Set up resolution codes in Generalized Codes Maintenance for field ccd_resolution. Use these codes to categorize the solution applied to the reported problem. These codes are typically more specific than those specified for the Resolution field of the Call Update frame.
Hours
Indicate the number of hours spent working on the resolution to the problem recorded on this line. The engineer scheduling sequence does not consider this figure, but it can be important in statistical reporting, especially if one engineer visit addresses multiple problems.
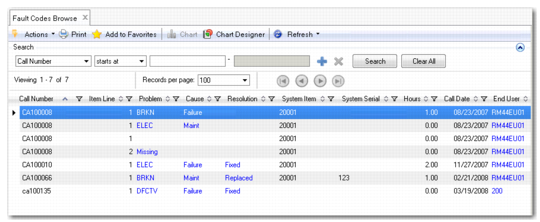
Fault Codes Browse
The Fault Code Browse (11.1.19.7) displays the problem fault code activity associated with calls. Fault codes are generally recorded after work on the call is complete and specific data is available regarding the problem cause.
Using the Fault Code Browse, you can display data on fault codes, end users, engineers, and service types. The browse also includes the ability to drill down for details, such as descriptions or names, and to create sub-groups for data, such as problem codes for items, cause codes for end users, and resolution codes for engineers.
The browse also provides the ability to chart data to display the percentage of each type of problem fault code.
Fault Code Browse (11.1.19.7)
Note: Use the Fault Code Analysis operational metric on the Service and Support Operational Metrics page in the Metrics folder to view a snapshot of calls received categorized according to fault codes. This metric allows you to identify the fault codes that occur most frequently and to determine appropriate corrective action, if required. For details on creating or modifying operational metrics refer to
Introduction to QAD Enterprise Applications User Guide.